How to Backtest a Trading Strategy Without Fooling Yourself
Last updated: July 19, 2026
Quick Answer
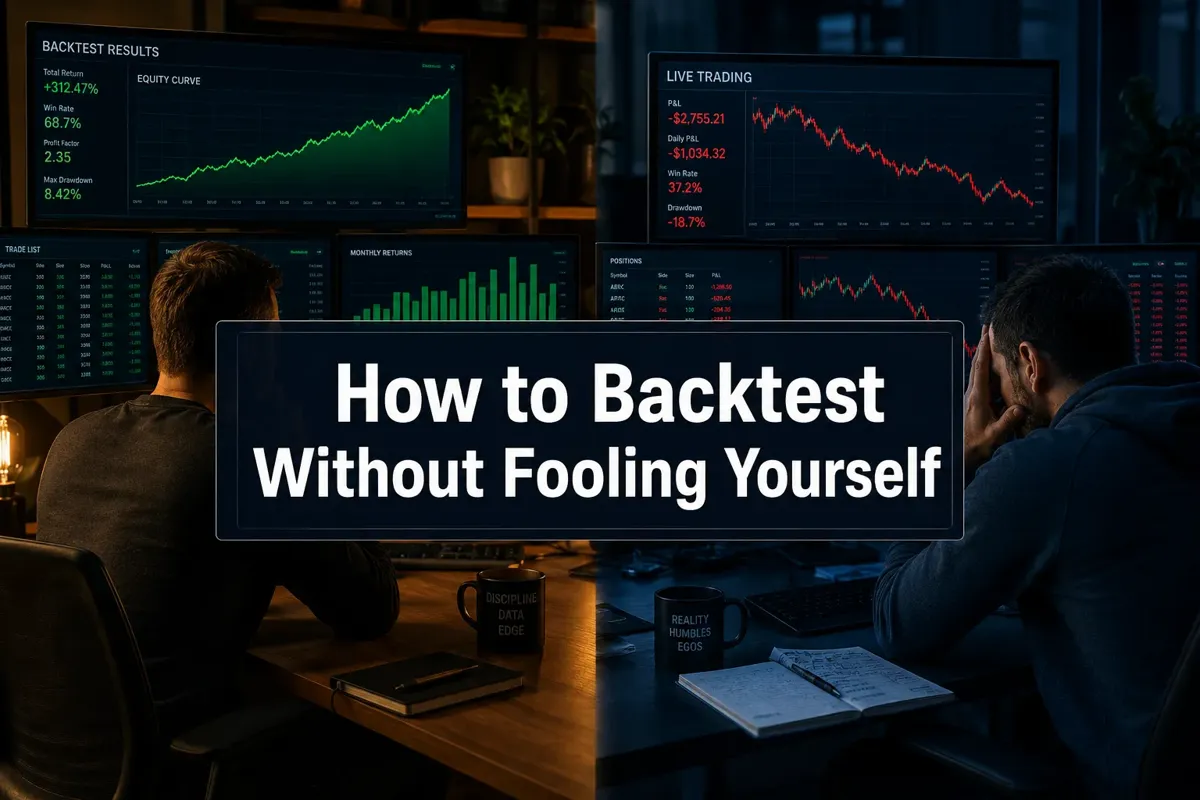
How to backtest a trading strategy without fooling yourself comes down to one truth: test it like you'll trade it, on data it's never seen, with all the costs and constraints of reality baked in. Most traders run a backtest, see a beautiful equity curve, and assume they've found edge. What they've actually found is a strategy perfectly fitted to one slice of history that will fall apart the moment real money touches it. The fix isn't more indicators or fancier software, it's disciplined process: split your data, test out of sample, account for slippage and fees, and demand statistical significance before you risk a dime.
Key Takeaways
- Backtesting reveals whether a strategy had edge in the past, not whether it will work tomorrow, treat it as necessary but not sufficient.
- Overfitting (curve fitting) is the silent killer: a strategy that works perfectly on historical data but fails live because it memorized noise instead of learning signal.
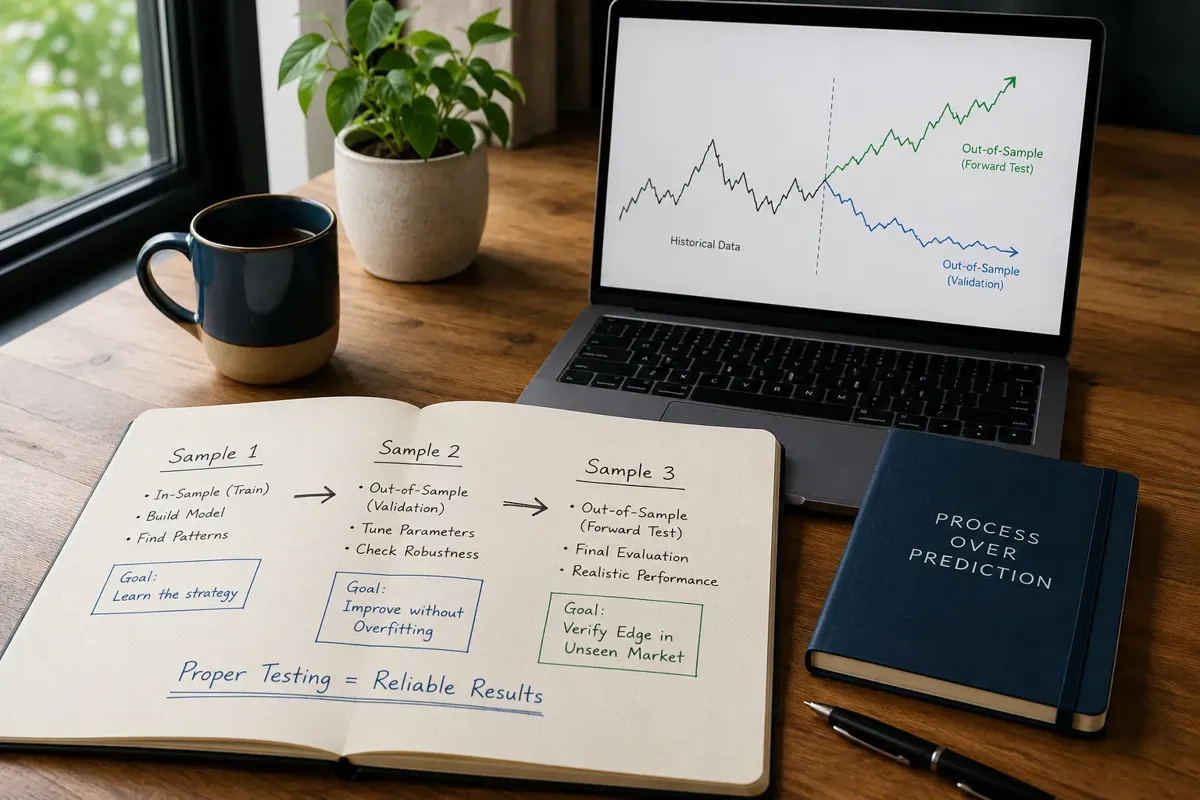
- Always split data into in-sample (for building) and out-of-sample (for validation), never test on the same data you used to create the rules.
- Walk-forward analysis tests a strategy across rolling time windows, simulating how it would have performed as new data arrived in real time.
- Transaction costs, slippage, and survivorship bias will destroy a backtest's credibility if you ignore them, model reality, not fantasy.
- Statistical significance matters: a strategy with 15 trades over three years tells you almost nothing; one with 200+ trades starts to mean something.
- Metrics beyond profit, Sharpe ratio, maximum drawdown, win rate, and average risk-reward, reveal whether a strategy is robust or lucky.
- The best backtest is the one that survives out-of-sample testing, walk-forward analysis, and Monte Carlo simulation, then still looks tradeable.
What Is Backtesting in Trading?
Backtesting is the process of applying a trading strategy's rules to historical price data to see how it would have performed. You define entry and exit criteria, maybe a moving average crossover, a breakout above resistance, or a specific risk-reward setup, then run those rules backward through months or years of past market data. The output is a simulated track record: how many trades, win rate, total return, drawdown, and other performance metrics.
It's not a crystal ball. Backtesting doesn't predict the future; it stress-tests whether your idea had any edge in the past. If a strategy can't make money on historical data, it won't magically work live. But the reverse isn't guaranteed either, a strategy that crushed it in a backtest can still blow up in real trading if the test was sloppy, overfit, or ignored real-world friction.
Think of backtesting as the first filter, not the final verdict. It separates ideas worth paper trading from ideas you should delete before they cost you money. The goal isn't a perfect equity curve, it's a realistic one that survives scrutiny and still looks worth trading.
How to Backtest a Trading Strategy Without Fooling Yourself
Here's the central problem: most traders backtest until they find something that works, then stop. They've just committed the cardinal sin of data mining, torturing the data until it confesses. The strategy didn't prove itself; the trader proved they can find patterns in randomness.
How to backtest a trading strategy without fooling yourself requires flipping that process. You define the rules first, based on a hypothesis about market behavior (momentum persists, mean reversion after overextension, breakouts from tight consolidation). Then you test those rules on data the strategy has never seen. If it works out of sample, you move to the next validation layer. If it doesn't, you kill it or refine the hypothesis, not the parameters.
The discipline is simple but brutal: never optimize on the full dataset. Split your data in half. Build and tune the strategy on the first half (in-sample), then validate on the second half (out-of-sample). If performance collapses out of sample, the strategy memorized noise. If it holds up, you've found something that might be real edge.
Add walk-forward analysis to simulate how the strategy would adapt as new data arrived. Run Monte Carlo simulations to test whether the results could have happened by luck. Model slippage, commissions, and the bid-ask spread. Demand at least 100 trades, ideally 200+, before you trust any metric.
This process won't guarantee profits. But it will stop you from trading a fairy tale.
How to Avoid Overfitting When Backtesting a Trading Strategy
Overfitting is what happens when you tune a strategy so tightly to historical data that it becomes useless on new data. You've built a model of the past, not a model of market behavior. It's the trading equivalent of memorizing last year's test instead of learning the subject.
The warning signs are obvious once you know them: a strategy with ten parameters, all optimized to the third decimal. A backtest that works beautifully on one stock or one timeframe but falls apart everywhere else. An equity curve that's too smooth, with suspiciously few losing streaks. These are red flags that you've curve-fitted your way into a strategy that will fail the moment it meets reality.
The fix is constraint. Limit the number of rules and parameters. If you're testing a moving average crossover, pick two or three common periods (like 10/20, 20/50, 50/200) and test those, don't run 500 combinations hunting for the magic number. Use round numbers and common technical levels that other traders watch, because those create real support and resistance through collective behavior.
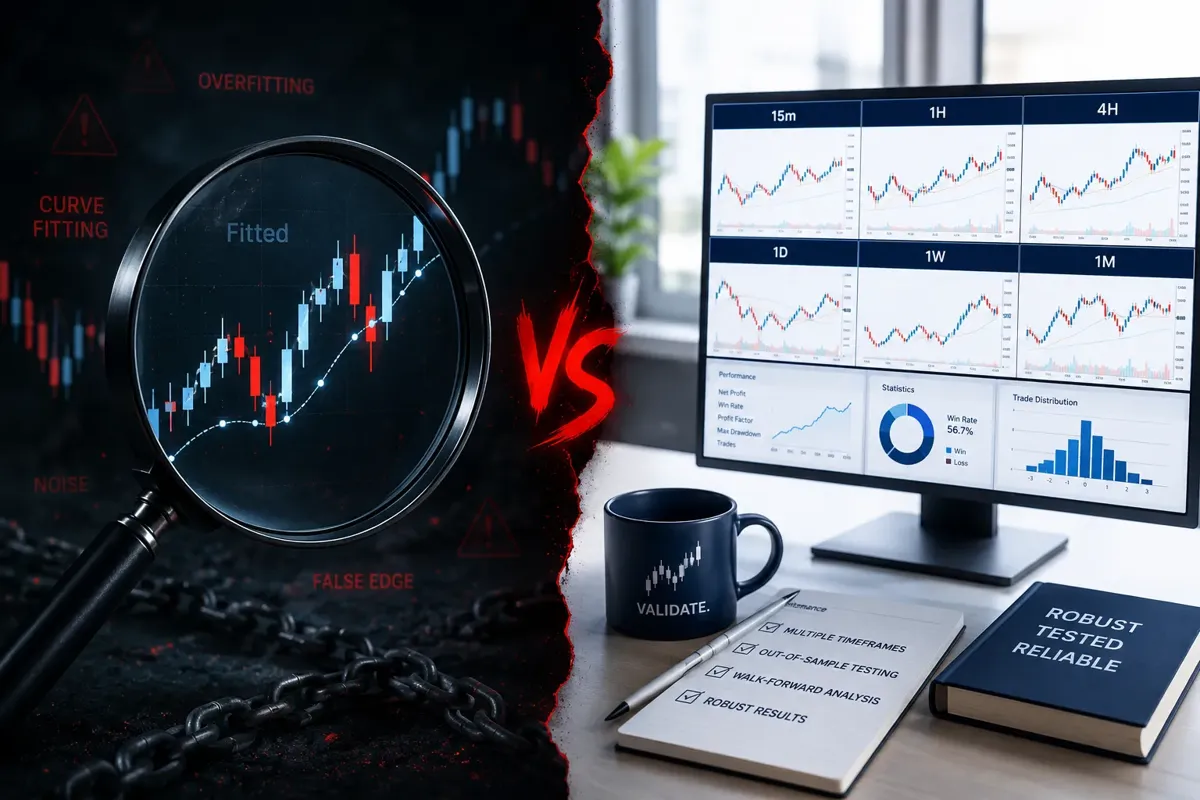
Test across multiple assets, timeframes, and market conditions. A robust strategy should work on more than one stock. If your breakout system only works on low-float momentum plays during bull markets, you don't have a strategy, you have a very expensive lesson waiting to happen.
Most importantly, always validate out of sample. If you optimized parameters on 2020-2023 data, test the final ruleset on 2024-2025 data it's never seen. If performance holds, you're onto something. If it craters, you overfit. The out-of-sample test is the only honest referee in this game.
For traders building algo strategies or testing on platforms like TradingView or QuantConnect, overfitting is the default outcome unless you actively design against it. Systems over hacks means building strategies that survive stress, not strategies that pass one test.
What Is the Difference Between In-Sample and Out-of-Sample Testing?
In-sample data is the historical period you use to build and optimize your strategy. Out-of-sample data is the period you hold back to validate whether the strategy actually works or just got lucky.
Here's the analogy: in-sample is your practice exam. You study it, learn the patterns, tune your approach. Out-of-sample is the real exam, different questions, same concepts. If you only studied the practice test, you'll bomb the real one.
Most traders make the mistake of testing on 100% of their data, optimizing until they get a result they like, then calling it done. That's not a backtest, it's a fantasy. You've shown the strategy every piece of data it will ever be graded on, so of course it looks good. The moment it sees new data (live trading), it fails.
The standard approach: split your data 70/30 or 60/40. Use the first chunk (in-sample) to develop the rules, tune parameters, and test variations. Lock those rules. Then run the exact same strategy on the remaining chunk (out-of-sample) without changing anything. If performance stays consistent, not identical, but in the same ballpark, the strategy might have real edge. If it collapses, you overfit.
Out-of-sample testing is the single most important step in how to backtest a trading strategy honestly. It's the difference between a strategy that works and a story you told yourself.
Common Mistakes Traders Make When Backtesting Strategies
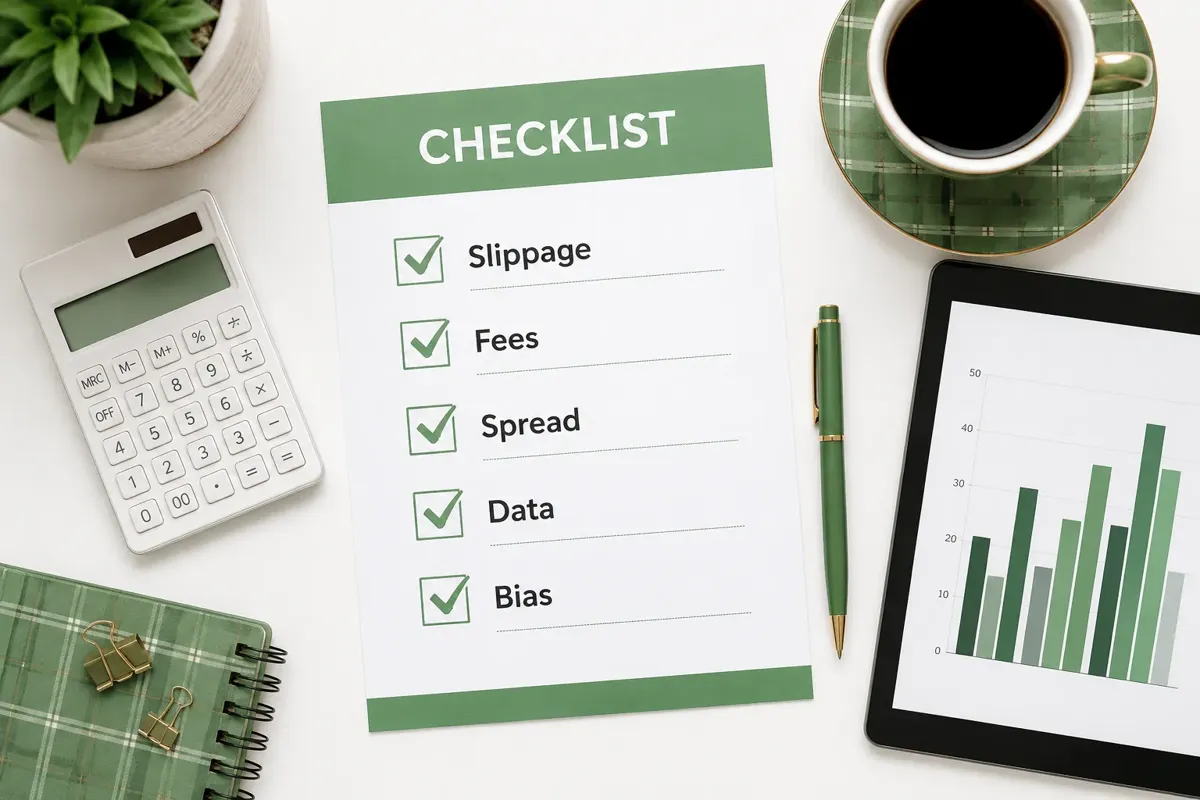
Ignoring transaction costs. Every backtest that doesn't model commissions, slippage, and the bid-ask spread is a lie. A strategy that makes 200 trades a year and shows 15% annual returns might net 6% after costs, or go negative if you're day trading. Model reality or don't bother testing.
Survivorship bias. If you backtest on a list of current S&P 500 stocks, you're only testing winners, the companies that survived. You're ignoring all the stocks that got delisted, went bankrupt, or fell out of the index. That inflates your results. Use a survivorship-bias-free dataset or accept that your backtest is fantasy.
Peeking into the future. This one's subtle but deadly. If your strategy uses an indicator that recalculates based on future data (like some pivot points or certain moving averages), you're cheating. The backtest sees information that wouldn't have been available at the time of the trade. Always use point-in-time data.
Testing on too little data. A backtest with 15 trades over two years tells you almost nothing. Randomness dominates small samples. You need at least 100 trades to start trusting the metrics, and 200+ to feel confident. If your strategy doesn't generate enough trades, it's not robust, it's rare.
Optimizing until it works. If you test 50 variations of a strategy and only show the one that worked, you've committed data mining. The other 49 failed, but you're pretending they don't exist. That's not edge, it's selection bias. The strategy that looks best in hindsight is often the one that will fail going forward.
Ignoring drawdown. A strategy that returns 30% a year but drops 60% twice along the way is untradeable for most retail traders. You'll quit during the drawdown, right before it recovers. Maximum drawdown and drawdown duration matter as much as return. If you can't stomach the worst losing streak in the backtest, you can't trade the strategy.
Not testing across market conditions. A breakout strategy that crushes during a 2020-2021 bull run and dies during a 2022 bear market isn't a strategy, it's a bull-market trade. Test across at least one full cycle: bull, bear, and choppy sideways action. If it only works in one environment, you don't have edge, you have a trade that worked once.
These mistakes are common because they're easy and they feel good. Fixing them is harder, but it's the only way to build a strategy you can actually trade with real money. For more on avoiding these traps, see our breakdown of algorithmic trading AI and what retail traders get wrong.
How Much Historical Data Do I Need to Backtest a Trading Strategy Properly?
The short answer: enough to generate at least 100 trades, ideally 200+, across multiple market conditions.
The longer answer depends on your strategy's timeframe and trade frequency. A day trading strategy that takes five trades a day can gather 100 trades in a month. A swing trading strategy that takes two trades a month needs years of data to hit the same sample size.
As a baseline, test on at least two to three years of data if you're swing trading, and at least six months to a year if you're day trading. But the real metric isn't time, it's the number of independent trades. Thirty trades over three years is statistically meaningless. Two hundred trades over six months starts to tell you something.
You also need enough data to cover different market regimes: trending up, trending down, and chopping sideways. A strategy that only saw a bull market in its backtest is untested. If your data doesn't include at least one bear market or a sustained period of choppy, low-volatility action, you don't know how the strategy behaves under stress.
More data is better, but only if it's relevant. Testing a momentum breakout strategy on data from the 1980s, when market structure, liquidity, and information flow were completely different, won't tell you much about how it works today. Focus on recent, relevant data that reflects current market conditions.
For traders using AI backtesting tools or algo platforms, this is where walk-forward analysis becomes essential. Instead of one static test, you're running the strategy forward through time, reoptimizing periodically, and validating on fresh data at each step. It's more work, but it's also more honest.
What Is Walk-Forward Analysis in Backtesting?
Walk-forward analysis is a method of backtesting that simulates how a strategy would perform as new data arrives in real time. Instead of testing once on a static dataset, you test repeatedly across rolling windows of data, reoptimizing the strategy at regular intervals and validating it on the next unseen period.
Here's how it works. You split your data into chunks, say, six-month periods. You optimize the strategy on the first period (in-sample), then test it on the second period (out-of-sample). Then you roll forward: optimize on periods one and two, test on period three. Optimize on periods two and three, test on period four. You repeat this process across the entire dataset.
The result is a series of out-of-sample tests that show how the strategy would have performed if you'd been trading it live and adapting it over time. If performance stays consistent across all the out-of-sample windows, the strategy is robust. If it works in some periods and fails in others, you've found a strategy that's fragile or regime-dependent.
Walk-forward analysis is harder than a single backtest, but it's also far more realistic. Markets change. A strategy optimized on 2020 data might not work in 2023. Walk-forward testing forces the strategy to prove it can adapt without overfitting to any single period.
This approach is especially valuable for algo traders and anyone building systematic strategies on platforms like TrendSpider or QuantConnect. It's the difference between a strategy that worked once and a strategy that keeps working.
For a deeper dive into how retail traders are using walk-forward methods with AI tools, check out the AI stock trading software active traders quietly swear by.
Best Backtesting Software for Retail Traders
The right backtesting software depends on your skill level, strategy type, and how much control you want over the process.
TradingView is the go-to for most retail traders. It's visual, intuitive, and lets you backtest strategies using Pine Script without needing a computer science degree. You can test on stocks, forex, crypto, and futures, and the platform handles data quality and survivorship bias for you. The downside: it's not as granular as institutional tools, and you're limited by what Pine Script can do. But for swing traders and anyone testing technical setups, it's more than enough.
QuantConnect is for traders who want full control and don't mind writing code. It's open-source, supports multiple asset classes, and gives you access to institutional-grade data. You can model slippage, commissions, and order types with precision. The learning curve is steep, you'll need Python or C#, but the flexibility is unmatched. If you're serious about algo trading, this is the platform.
TrendSpider is built for technical traders who want automation without coding. It has built-in backtesting for chart patterns, indicators, and multi-timeframe strategies. The interface is clean, the data is solid, and it integrates with your brokerage for live trading. It's pricier than TradingView but worth it if you're testing complex technical setups.
Composer is a no-code platform for building and backtesting systematic strategies. You drag and drop logic blocks, backtest on ETFs and stocks, and deploy strategies live without writing a line of code. It's perfect for beginners or anyone who wants to test ideas quickly without the overhead of learning a programming language. The tradeoff: less control over execution details.
MetaStock and Amibroker are legacy tools that still have loyal followings. They're powerful, customizable, and handle large datasets well. But the interfaces feel dated, and the learning curve is steep. If you're already using one, stick with it. If you're starting fresh, TradingView or QuantConnect will serve you better.
For a full comparison of AI-powered backtesting and trading tools, see the best AI trading tools of 2026 put head to head.
How to Account for Transaction Costs and Slippage in Backtests
Transaction costs and slippage are the silent killers of backtested strategies. Ignore them and your 20% annual return becomes 8%, or negative.
Commissions are straightforward. If your broker charges $1 per trade, and your strategy makes 200 trades a year, that's $200 in costs. Subtract it from your gross return. Most platforms let you input a fixed commission per trade or a percentage of trade value. Use the number your actual broker charges.
Slippage is trickier. It's the difference between the price you wanted and the price you got. If you try to buy at $50 but the order fills at $50.05, that's five cents of slippage. It happens because of market impact (your order moves the price), latency (the price moves before your order arrives), or low liquidity (there aren't enough shares at your target price).
For liquid stocks and ETFs, model 0.05% to 0.10% slippage per trade. For low-float or illiquid names, use 0.20% to 0.50%. For day trading strategies with tight stops, slippage can eat half your edge. Test with conservative assumptions, if the strategy still works with 0.20% slippage, it's robust. If it only works with zero slippage, it's a fantasy.
Bid-ask spread is another hidden cost. If a stock's bid is $49.95 and the ask is $50.05, you're paying a ten-cent spread every time you round-trip a trade. For strategies that trade frequently or hold for short periods, the spread adds up fast. Model it by assuming you buy at the ask and sell at the bid.
Most backtesting platforms let you input these costs manually. Do it. A backtest without transaction costs is a marketing pitch, not a trading plan. For more on what real traders are using to model costs accurately, see AI trading software: what you pay for vs. what you get.
Why Does My Strategy Work in Backtesting but Fail in Live Trading?
Because backtesting is a simulation, and live trading is reality. The gap between the two is where most strategies die.
You overfit. The strategy was tuned so tightly to historical data that it memorized noise instead of learning signal. It worked perfectly on the past because it was designed to. The moment it saw new data, it failed. The fix: validate out of sample and use walk-forward analysis.
You ignored costs. Your backtest assumed zero slippage, no commissions, and instant fills at the midpoint. Live trading doesn't work that way. Every trade costs money, and every order has friction. Model reality in your backtest or accept that your results are fiction.
You peeked into the future. Your backtest used data that wouldn't have been available at the time of the trade, repainting indicators, end-of-day data on intraday trades, or revised earnings numbers. Live trading doesn't let you cheat. Use point-in-time data only.
You didn't account for market impact. Your backtest assumed you could buy 10,000 shares at the exact price you wanted. In reality, a large order moves the market against you. If you're trading low-float or illiquid stocks, this effect is brutal. Test with realistic position sizes.
You traded during a different market regime. Your backtest covered a bull market, and you went live during a bear market. Or vice versa. Strategies are regime-dependent. A momentum breakout system that crushes in trending markets will chop you up in sideways action. Test across multiple conditions or accept that your strategy only works sometimes.
You couldn't handle the drawdown. The backtest showed a 30% drawdown, and you thought you could stomach it. Then it happened live, and you panicked and quit. Backtests don't model your psychology. If you can't handle the worst losing streak in the test, you can't trade the strategy.
You didn't paper trade it first. You went straight from backtest to live money. That's a mistake. Paper trade the strategy for at least 30 days to see how it behaves in real time, with real emotions, and real execution challenges. Most strategies that survive backtesting fail paper trading. Better to learn that with fake money.
The gap between backtest and live performance is normal. A strategy that returns 15% in a backtest might return 10% live after costs and slippage. That's fine. A strategy that returns 15% in a backtest and loses money live is broken. The difference is whether you tested honestly.
For more on bridging the gap between theory and execution, see how to find stocks for swing trading before everyone else does.
What Is Survivorship Bias in Backtesting?
Survivorship bias is what happens when you backtest only on stocks that are still around today, ignoring all the ones that failed, got delisted, or went bankrupt. It makes your strategy look better than it is because you're only testing on winners.
Here's the problem: if you backtest a momentum strategy on the current S&P 500, you're testing on 500 companies that survived. You're not testing on Enron, Lehman Brothers, or the hundreds of other stocks that blew up along the way. Your strategy might have bought those disasters, but your backtest never shows it because those stocks aren't in your dataset.
The result: inflated returns, understated risk, and a false sense of confidence. A strategy that looks like it returned 20% a year might have returned 12% if you'd included the dead stocks.
The fix: use a survivorship-bias-free dataset. Most institutional platforms (QuantConnect, Bloomberg, Refinitiv) offer this. TradingView and free data sources usually don't. If you're testing on free data, assume your results are optimistic and discount them accordingly.
Survivorship bias is especially dangerous for long-term backtests and strategies that hold through earnings or other high-risk events. If you're testing a buy-and-hold strategy over 20 years, you need to know how many of your picks would have gone to zero. Without that, you're not testing a strategy, you're writing historical fiction.
How to Test a Trading Strategy Without Curve Fitting
Curve fitting (also called overfitting) is the process of tuning a strategy so perfectly to historical data that it becomes useless on new data. You've built a model of the past, not a model of the market.
The antidote is constraint and validation. Here's the process:
Start with a hypothesis. Don't start by testing random combinations of indicators. Start with a theory about why the strategy should work. "Stocks that break out of tight consolidation on high volume tend to continue higher because the breakout signals new buying interest." That's a hypothesis. Test it.
Use simple rules. The more parameters you add, the easier it is to overfit. A strategy with two or three rules is more likely to be robust than one with ten. If you're testing a moving average crossover, pick common periods (10/20, 20/50) and test those, don't optimize across 500 combinations.
Limit optimization. If you must optimize, do it on a small in-sample dataset, then validate on a large out-of-sample set. Never optimize on the full dataset. And never re-optimize after seeing the out-of-sample results, that's just curve fitting with extra steps.
Test across assets and timeframes. A robust strategy should work on more than one stock or one timeframe. If your breakout system only works on Tesla in 2020, you don't have a strategy, you have a historical accident. Test on at least 10-20 different stocks, and test on multiple timeframes (daily, weekly, 4-hour).
Use walk-forward analysis. This forces the strategy to prove it can adapt to new data without overfitting to any single period. If performance stays consistent across all out-of-sample windows, the strategy is robust.
Demand statistical significance. A strategy with 15 trades could be pure luck. One with 200 trades starts to mean something. Use Monte Carlo simulation to test whether the results could have happened by chance.
Curve fitting is the default outcome of backtesting unless you actively design against it. The goal isn't to find the strategy that worked best in the past, it's to find the strategy that's most likely to work in the future. Those are not the same thing.
For more on building robust systems instead of overfit hacks, see AI portfolio management: where it beats doing it yourself.
Is Backtesting Useful for Beginners or Should I Paper Trade Instead?
Both. They serve different purposes.
Backtesting is faster. You can test a strategy across years of data in minutes and see whether it has any edge at all. It's the first filter, the thing that tells you whether an idea is worth pursuing. If a strategy can't make money on historical data, it won't make money live. Backtesting saves you from wasting weeks paper trading a broken idea.
Paper trading is slower but more realistic. It forces you to execute the strategy in real time, with real emotions, and real market conditions. You'll learn things backtesting can't teach you: how it feels to watch a stop loss get hit, how hard it is to pull the trigger on a setup, how often you second-guess your rules. Paper trading is where you learn whether you can actually trade the strategy, not just whether the strategy works.
For beginners, the sequence is: backtest first, paper trade second, live trade third. Backtest to validate the idea. Paper trade to validate yourself. Live trade with small size to validate execution. Skip any step and you're gambling.
The mistake most beginners make is skipping straight to live trading because backtesting feels like homework and paper trading feels fake. Then they lose real money on a strategy they never tested. That's expensive education.
If you're new to backtesting, start with a simple strategy on TradingView or Composer. Test it on at least two years of data. If it works, paper trade it for 30 days. If you can follow the rules and the results hold up, start live with small size. If you can't follow the rules or the results fall apart, kill it and move on.
For more on building a repeatable process, see the AI trading assistant that never sleeps and never panics.
What Metrics Should I Look at Besides Profit When Backtesting?
Profit is the headline, but it's not the whole story. A strategy that makes 50% one year and loses 40% the next is untradeable for most people. Here are the metrics that matter:
Sharpe ratio. This measures risk-adjusted return, how much return you're getting per unit of risk. A Sharpe ratio above 1.0 is decent. Above 2.0 is strong. Below 0.5 means you're taking too much risk for the return. It's one of the best single metrics for comparing strategies.
Maximum drawdown. This is the largest peak-to-trough decline in your account during the backtest. If your strategy drops 50% at some point, can you handle that psychologically? Most retail traders can't. A strategy with a 15% max drawdown is far more tradeable than one with a 40% drawdown, even if the latter has higher returns.
Win rate. The percentage of trades that are profitable. A 60% win rate means six out of ten trades make money. But win rate alone is meaningless, a strategy with a 40% win rate and a 3:1 risk-reward can be more profitable than one with a 70% win rate and a 1:1 risk-reward.
Average risk-reward. The ratio of your average winner to your average loser. If your average winner is $300 and your average loser is $100, your risk-reward is 3:1. This is more important than win rate. You can lose more often than you win and still make money if your winners are big enough.
Profit factor. Total gross profit divided by total gross loss. A profit factor of 2.0 means you made twice as much on winning trades as you lost on losing trades. Anything above 1.5 is solid. Below 1.2 is fragile.
Number of trades. A backtest with 15 trades is statistically meaningless. One with 200+ trades starts to be credible. More trades = more confidence that the results aren't just luck.
Average trade duration. How long you hold each trade. This matters for position sizing and capital efficiency. A strategy that holds for three days is very different from one that holds for three months, even if the returns are similar.
Consecutive losers. The longest losing streak in the backtest. If your strategy had eight losing trades in a row, can you handle that without quitting? Most traders can't. This metric tells you whether the strategy is psychologically tradeable.
These metrics together paint a picture of whether a strategy is robust, tradeable, and worth your time. Profit alone doesn't tell you that. For more on what to measure and why, see the position sizing mistake that wipes out 90% of new traders.
How Many Trades Do I Need in a Backtest for It to Be Statistically Significant?
At least 100. Ideally 200 or more.
Anything less than 100 trades is too small a sample to separate skill from luck. A strategy with 15 trades that shows a 70% win rate could easily be random noise. Run that same strategy on new data and the win rate might drop to 40%.
The more trades you have, the more confident you can be that the results reflect real edge and not just a lucky streak. A backtest with 500 trades is far more credible than one with 50, even if the returns are lower.
This is where Monte Carlo simulation helps. It takes your backtest results and runs thousands of random variations, shuffling the order of trades, randomizing entry timing, adjusting win/loss sequences, to see how often you'd get similar results by chance. If your strategy's performance falls within the top 5% of random outcomes, it's statistically significant. If it's in the middle of the pack, it's luck.
For strategies that don't generate many trades, like long-term position trading or low-frequency swing setups, you'll need more years of data to hit 100+ trades. If you can't get there, the backtest isn't reliable. Either increase trade frequency, test on more assets, or accept that you're trading on faith, not data.
Statistical significance is the difference between a strategy you can trust and a story you're telling yourself. Demand the sample size before you risk real money.
FAQ
What is the most common mistake in backtesting?
Overfitting the strategy to historical data by optimizing parameters until the backtest looks perfect, then failing to validate out of sample. The strategy memorized the past instead of learning market behavior.
Can I backtest without coding?
Yes. Platforms like TradingView, TrendSpider, and Composer let you backtest strategies using visual tools or drag-and-drop logic. You don't need to write code, but you do need to understand the strategy's rules and constraints.
How do I know if my backtest is realistic?
Model transaction costs, slippage, and the bid-ask spread. Use survivorship-bias-free data. Test out of sample. If the strategy still works after all that, it's realistic. If it only works with zero costs and perfect fills, it's fiction.
What is walk-forward analysis?
A method of backtesting that simulates real-time trading by optimizing on one period, testing on the next, then rolling forward. It shows how the strategy would have performed if you'd been adapting it over time, not just testing it once.
Should I backtest on daily or intraday data?
Depends on your strategy. If you're swing trading, daily data is fine. If you're day trading, you need intraday data (1-minute, 5-minute, or tick data) to model realistic entries, exits, and slippage.
How long should I paper trade before going live?
At least 30 days, ideally 60-90. Paper trading shows you whether you can follow the rules, handle the emotions, and execute the strategy in real time. If you can't make it work on paper, you won't make it work live.
What is a good Sharpe ratio for a trading strategy?
Above 1.0 is decent. Above 2.0 is strong. Above 3.0 is rare and usually means the strategy is either very low-risk or the backtest is too good to be true. Below 0.5 means you're taking too much risk for the return.
Can I trust backtests from trading software?
Only if you understand what the software is modeling. Check whether it accounts for slippage, commissions, and survivorship bias. Verify the data quality. Run the same test on multiple platforms if possible. Trust, but verify.
What is Monte Carlo simulation in backtesting?
A method that runs thousands of random variations of your backtest, shuffling trade order, randomizing entry timing, adjusting win/loss sequences, to see how often the results could happen by luck. It tests statistical significance.
How do I avoid survivorship bias?
Use a survivorship-bias-free dataset that includes delisted, bankrupt, and merged companies. Most institutional platforms offer this. If you're using free data, assume your results are optimistic and discount them.
What is the difference between backtesting and forward testing?
Backtesting tests a strategy on historical data. Forward testing (or paper trading) tests it on live data in real time, without risking real money. Both are necessary, backtesting validates the idea, forward testing validates execution.
Can I backtest options strategies?
Yes, but it's harder. You need historical options data (which is expensive), and you need to model implied volatility, bid-ask spreads, and early assignment risk. Most retail platforms don't support options backtesting well. QuantConnect and institutional tools do.
Conclusion
How to backtest a trading strategy without fooling yourself isn't about finding the perfect equity curve, it's about building a process that survives scrutiny. Split your data. Test out of sample. Model costs and slippage. Demand statistical significance. Use walk-forward analysis. Test across multiple assets and market conditions. If the strategy still works after all that, you've found something worth paper trading.
Most traders skip these steps because they're hard and they slow you down. Then they wonder why their backtest returned 30% and their live account is down 15%. The gap isn't bad luck, it's bad process.
Backtesting is the first filter, not the final answer. It separates ideas worth pursuing from ideas you should delete. But it's not a crystal ball. A strategy that worked in the past might not work in the future. Markets change. Edge decays. The only way to know if a strategy still works is to trade it, first on paper, then with small size, then with conviction if it proves itself.
The traders who survive aren't the ones with the fanciest indicators or the most complex algorithms. They're the ones who test honestly, trade what they tested, and cut what doesn't work. Systems over hacks. Process over prediction. Discipline beats prediction.
Want the tools and systems behind this, without the hype? Start at aistockpickerapps.com.