How to Find Stocks for Swing Trading Before Everyone Else Does
Last updated: June 16, 2026
Quick Answer: Finding swing trade candidates before the crowd means combining a daily stock screener routine with relative strength filters, volume confirmation, and clean chart setups near key support and resistance levels. The traders who consistently spot opportunities early aren't psychic — they have a repeatable process. Build the system, run it every day, and the setups will find you.
Key Takeaways
- Swing trading holds positions for two to ten days, targeting short-term price moves — not the same game as day trading or buy-and-hold investing.
- A daily screening routine using free tools like Finviz or TrendSpider is the single most reliable way to build a fresh swing trade watchlist every session.
- Stocks near 52-week highs with rising relative strength are statistically more likely to continue moving than beaten-down names — buy strength, not hope.
- Volume is the market's lie detector: price moves without volume are suspects, not signals.
- Risk management — specifically your stop loss placement and position sizing — determines whether you survive long enough to be right.
- Most beginners lose money on process failures, not bad stock picks. Fix the process first.
- AI-powered screeners and scanners have compressed the time it takes to find quality setups from hours to minutes.
- Paper trade it first. Seriously. Every system looks great until real money is on the line.
What Exactly Is Swing Trading and How Is It Different from Day Trading
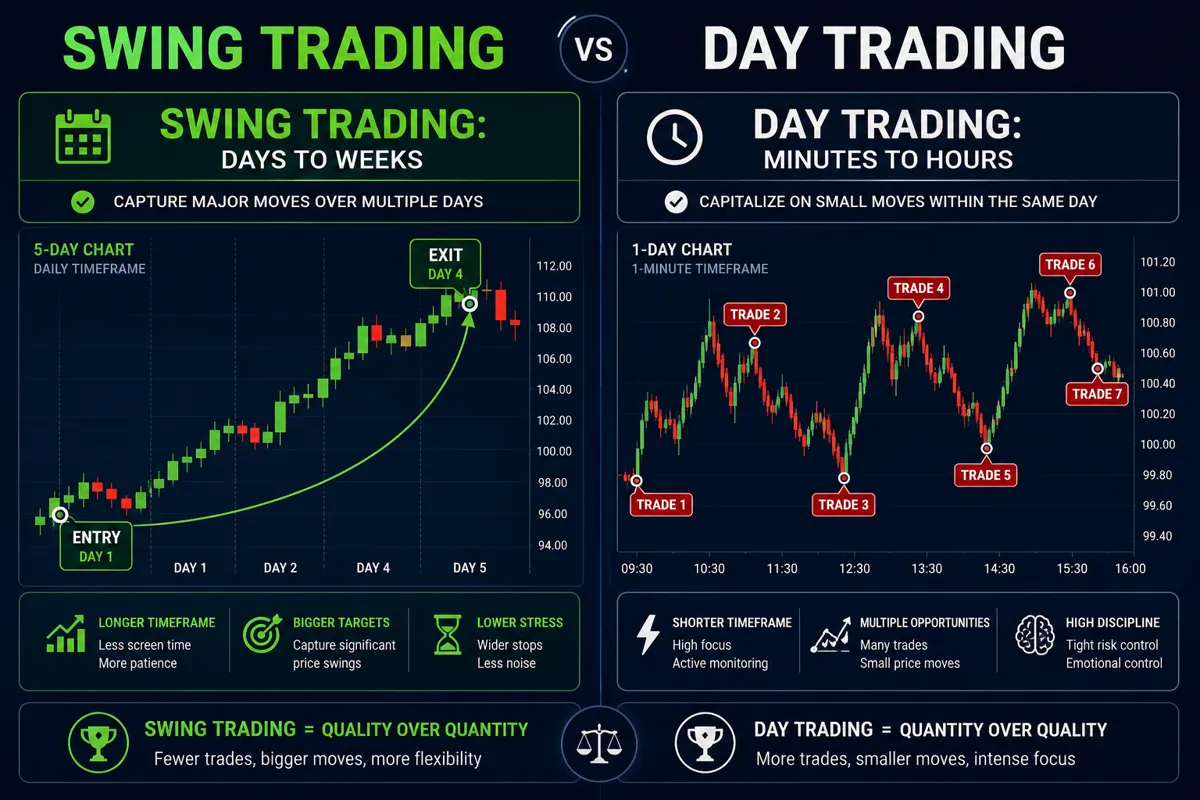
Swing trading is a medium-term strategy where traders hold stocks for two to ten days, aiming to capture a single directional price move — the "swing" — before exiting. It's distinct from day trading, where all positions are opened and closed within the same session, and from long-term investing, where holding periods stretch months or years.
The practical difference matters for your lifestyle as much as your strategy. Day traders need to be glued to a screen from 9:30 a.m. to 4:00 p.m. Eastern. Swing traders do their homework the night before, set their entries and exits, and check in periodically. That's why swing trading is often the first active strategy that works for people with jobs, families, or a life outside the market.
The core mechanics of a swing trade:
- You identify a stock in a clear trend or approaching a key breakout level.
- You enter at a defined price with a predetermined stop loss (the price at which you accept you're wrong and exit).
- You hold for two to ten days while the move plays out.
- You exit at your target or get stopped out — whichever comes first.
The biggest misconception beginners carry into swing trading: they think it's about finding the right stock. It's actually about finding the right setup on the right stock at the right time. Those are three different things, and conflating them is where most people go wrong.
How to Find Stocks for Swing Trading Before Everyone Else Does
This is the actual question, so let's answer it directly. The traders who consistently find swing trade candidates early share one habit: they run a structured daily screening process, not a Twitter feed.
Here's the framework that separates early movers from late chasers.
Step 1: Start with a Liquidity and Quality Filter
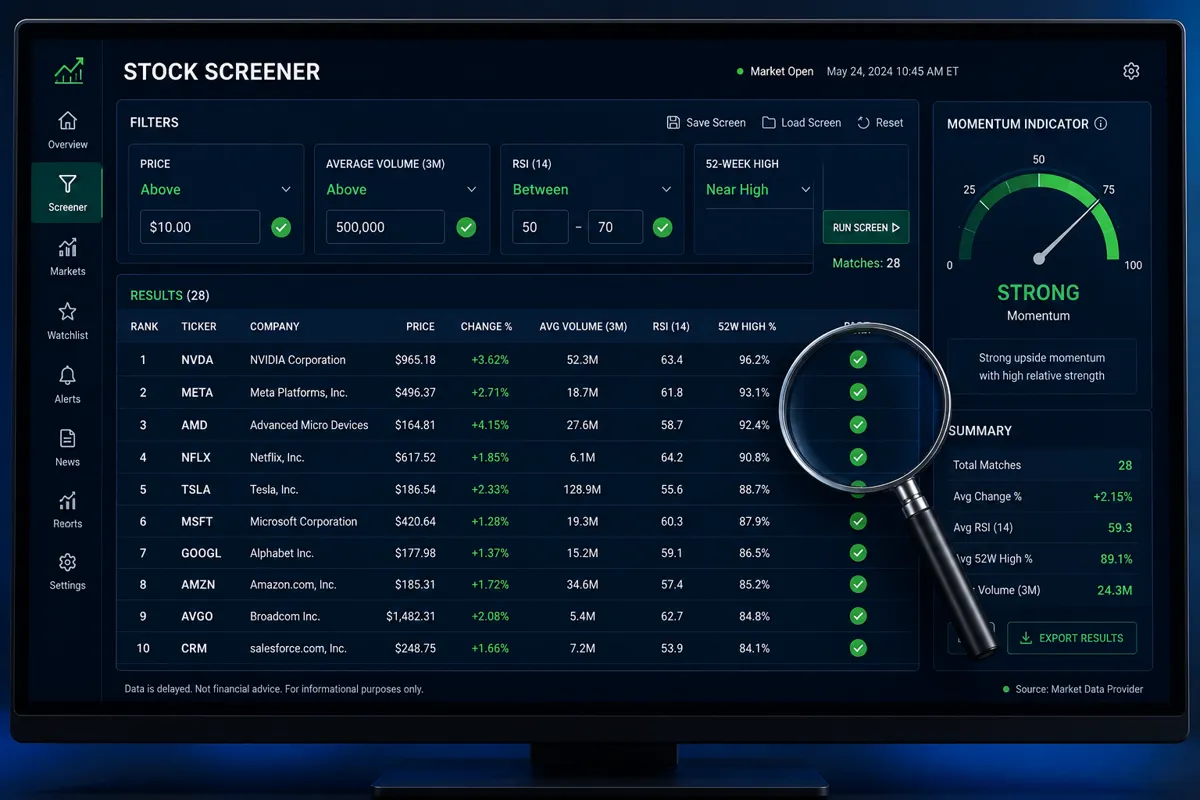
Before anything else, filter out the garbage. Stocks trading fewer than 500,000 shares per day on average are a trap for retail traders — the spread is wide, fills are ugly, and you can get stuck in a position you can't exit cleanly.
Minimum baseline filters to set in any screener:
- Average daily volume: 500,000+ shares
- Price: $10 or above (avoids the low-float penny stock casino)
- Market cap: $300 million+ (mid-cap and above for cleaner price action)
This alone cuts the universe from thousands of stocks to a manageable few hundred worth looking at.
Step 2: Screen for Relative Strength and Momentum
Relative strength means a stock is outperforming its sector or the broader index. This is not the RSI indicator — it's a comparison of price performance. Stocks showing relative strength during a market pullback are the ones institutions are quietly accumulating. That's the signal you want.
Layer in momentum filters:
- Price within 5-10% of a 52-week high
- 50-day moving average trending upward
- RSI (Relative Strength Index) between 50 and 70 — strong but not overextended
Stocks near 52-week highs feel psychologically uncomfortable to buy. That discomfort is the point. The crowd is scared to buy strength; that's exactly why the setup works.
Step 3: Confirm with Volume
Volume is the market's lie detector. A stock breaking above resistance on average or below-average volume is a suspect. The same breakout on two to three times average volume is a signal.
Look for:
- Volume spike of 150-200%+ above the 20-day average on the breakout day
- Accumulation days (up days with rising volume) outnumbering distribution days over the past two weeks
- No single massive volume spike followed by silence — that's often a bull trap
Step 4: Check the Chart Setup
This is where most beginners skip straight to and most experienced traders spend the least time — because by Step 4, you've already filtered to only clean candidates.
The best swing trade setups share a few common traits:
- Tight consolidation: Price has moved sideways for several days in a narrow range, coiling energy before a move. This is called basing.
- Clear support and resistance: You can draw a clean line where buyers have stepped in before (support) and where sellers have capped the rally (resistance). The breakout happens when price clears resistance with volume.
- Alignment with key moving averages: Price bouncing off or holding above the 20-day or 50-day moving average confirms the trend is your friend.
The free swing trade planner at AI Stock Picker Apps can help you structure this process into a repeatable daily checklist.
Best Free Stock Screeners for Finding Swing Trading Opportunities
The best free screeners for swing trading in 2026 are Finviz, TrendSpider, and the built-in scanner inside TradingView. Each serves a different part of the process.
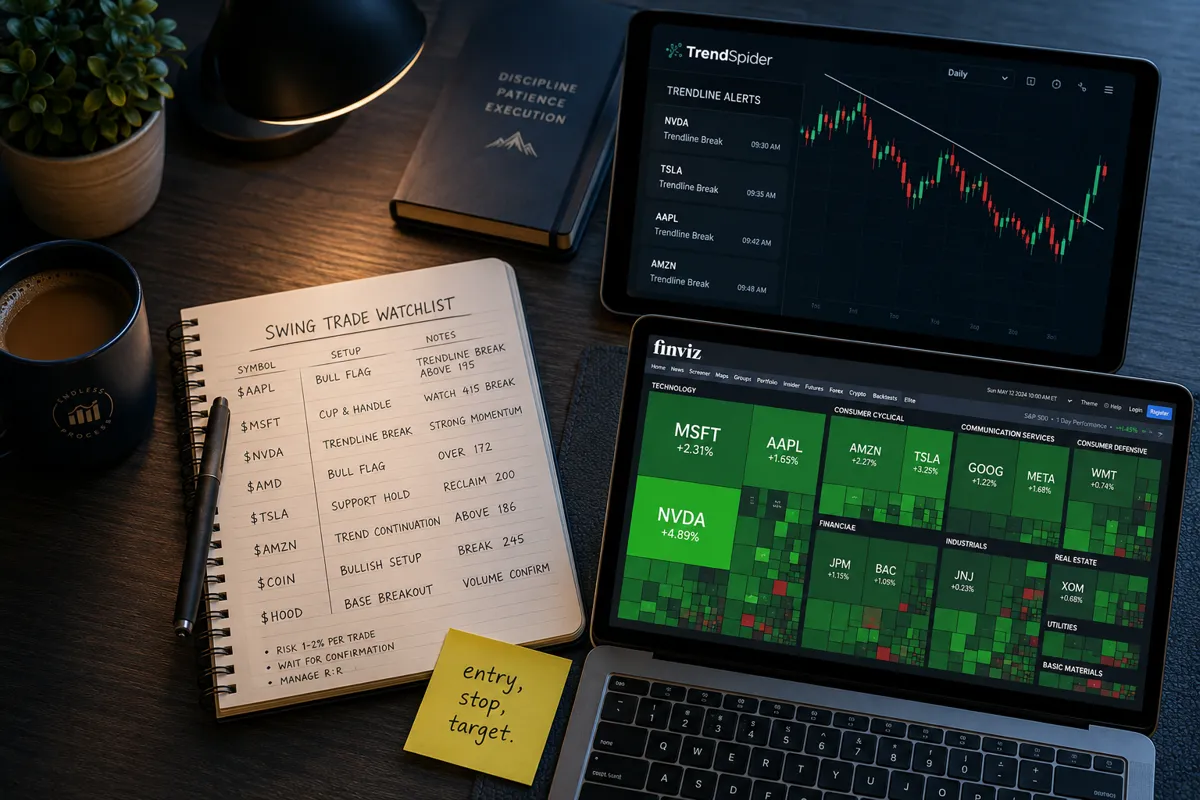
Finviz is the fastest way to run a fundamental-plus-technical filter combo. The visual heatmap alone tells you in thirty seconds which sectors are moving. Set your filters — volume, price, moving average position, RSI range — and you get a ranked list of candidates in seconds. Free tier is solid; the paid Elite version adds real-time data. Check out the Finviz breakdown to see how it stacks up.
TrendSpider goes deeper. It offers automated trendline detection, multi-timeframe analysis, and daily scanner emails that land in your inbox before the market opens. For traders who want AI-assisted chart reading without paying for a full institutional platform, TrendSpider is hard to beat. See the full TrendSpider review.
TradingView is the community standard for charting, with a built-in screener that's genuinely powerful at the free tier. The platform also lets you browse other traders' published screens and ideas — useful for seeing what setups experienced traders are watching, though always verify with your own analysis. Compare TradingView's features against other platforms.
For a broader comparison of screeners across price points and use cases, the AI stock screener directory covers 100+ tools with head-to-head breakdowns.
What Technical Indicators Work Best for Identifying Swing Trade Potential
The best technical indicators for swing trading are the ones you actually understand and apply consistently — not the ones with the most settings. That said, a short list of proven tools does most of the work.
The core four:
| Indicator | What It Measures | Swing Trading Use |
|---|---|---|
| Moving Averages (20, 50-day) | Trend direction and momentum | Entry confirmation, dynamic support |
| RSI (14-period) | Overbought/oversold momentum | Filter out overextended setups |
| MACD | Trend momentum and crossovers | Confirm direction of the swing |
| Volume | Conviction behind price moves | Validate breakouts, spot distribution |
The honest truth about indicators: they're all lagging. They confirm what price has already done. The real edge comes from reading price action directly — where is price relative to recent highs and lows, how is it behaving at support and resistance, and is volume confirming or contradicting the move. Indicators help filter noise; they don't replace reading the tape.
A common mistake is stacking six indicators on one chart and waiting for all of them to align. That's analysis paralysis dressed up as discipline. Pick two or three, understand what they're actually measuring, and use them consistently.
Which Stocks Are Best for Swing Trading if You're a Beginner
Beginners should focus on large-cap, high-liquidity stocks with clear trends and predictable price behavior. Think S&P 500 components, sector leaders, or well-known names with average daily volume above one million shares.
Why this matters: Liquid stocks have tight bid-ask spreads, which means you're not losing a percentage point just getting in and out. They also tend to respect technical levels more cleanly than thinly traded names, where a single large order can blow through your stop loss in seconds.
Good starting categories for swing trade candidates in 2026:
- Sector ETF leaders: The top holdings of whichever sector ETF is showing relative strength that week. If XLK (tech) is leading, look at the top five holdings.
- Earnings season setups: Stocks that reported strong earnings and are consolidating above the post-earnings gap. The gap fill is a known pattern worth tracking.
- Index components near 52-week highs: Stocks already outperforming the index that are pausing in a tight consolidation before the next leg up.
Avoid low-float stocks, biotech names with binary catalysts, and anything being pumped in a Discord server. Play stupid games, win stupid prizes. The beginner's job is to learn the process, not to find the one stock that triples.
How Much Money Do You Need to Start Swing Trading Stocks
You can technically start swing trading with $500, but the honest answer is that $5,000 to $10,000 gives you enough capital to manage position sizing properly without one bad trade wiping you out.
Here's the math that matters. A sound risk management rule is to risk no more than 1-2% of your account on any single trade. On a $1,000 account, that's $10 to $20 per trade. That's so small it barely covers commissions on some platforms and leaves no room for a meaningful position. On a $5,000 account, 1% risk is $50 — enough to take a real position in a $20-$50 stock with a tight stop loss.
The pattern day trader rule is the other constraint. In the U.S., FINRA requires a minimum of $25,000 in a margin account to make more than three day trades in a rolling five-day period. Swing trading sidesteps this rule because you're holding overnight — but know the rules before you run into them. FINRA's investor education resources explain account requirements clearly.
The bigger point: undercapitalization is one of the most common reasons new traders fail. Not because they picked bad stocks, but because they had no room to be wrong even once.
How Do Professional Traders Find Stocks Before They Move
Professional and experienced retail traders find early setups through a combination of sector rotation analysis, relative strength screening, and pre-market gap scanning — not by watching CNBC or following social media alerts.
The actual workflow most experienced swing traders use:
- Check sector rotation daily. Which sectors are showing money inflows? Sector ETF relative performance tells you where institutional money is moving before individual stocks show it clearly.
- Run a relative strength screen every evening. Stocks hitting new highs while the index is flat or down are being accumulated. That's the tell.
- Scan for pre-market gap-ups with volume. A stock gapping up 3-5% on earnings or news with heavy pre-market volume is flagging itself for a potential swing setup — if the chart structure supports it.
- Maintain a rolling watchlist. Not a list of stocks to buy tomorrow, but a list of stocks to watch for the right setup. The watchlist is where discipline lives.
- Use AI tools to compress the screening time. Tools like Trade Ideas and Blackbox Stocks run real-time scans that surface unusual options activity and momentum signals before they show up on mainstream feeds.
The edge isn't secret information. It's a consistent process run before the crowd wakes up.
How to Use Volume and Momentum to Predict Stock Movements
Volume and momentum together are the most reliable early warning system available to retail traders. Volume measures how many shares traded; momentum measures the rate of price change. When both are rising together, the move has conviction.
Volume signals worth knowing:
- Breakout on high volume: Price clears a resistance level with 150%+ of average daily volume. This is the cleanest entry signal in swing trading.
- Pullback on low volume: Price pulls back toward support but volume dries up. Sellers aren't motivated. This is often the best entry point in a trending stock.
- High volume reversal bar: A big volume day where price closes near the low after opening high. Sellers are in control. Exit or avoid.
Momentum indicators that work:
- Rate of Change (ROC): Measures how fast price is moving over a set period. Rising ROC on a breakout confirms acceleration.
- Relative Volume (RVOL): Today's volume compared to the average for this time of day. RVOL above 2.0 during the first hour (power hour is 9:30-10:30 a.m. Eastern) is a strong signal.
The combination to look for: price breaking above resistance, RSI crossing above 60, MACD histogram turning positive, and volume running at 2x or more of average. That's the clean setup. Not every trade will have all four, but the more boxes checked, the higher the probability.
What Risk Management Strategies Protect You During Swing Trades
Risk management is not the boring part of swing trading — it's the only part that determines whether you're still trading in six months. The setup gets you in; risk management keeps you alive.
The non-negotiable rules:
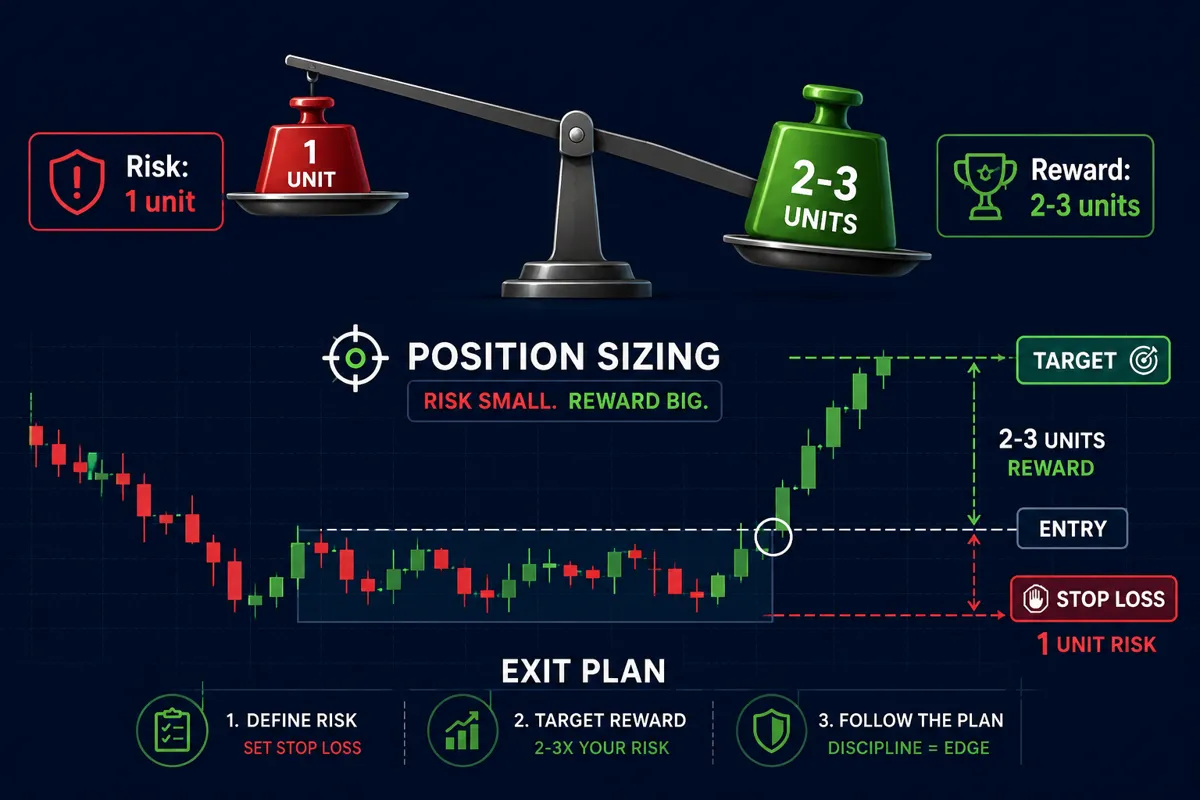
- Always define your stop loss before entering. A stop loss is the price at which you admit the trade is wrong and exit. Set it at a logical technical level — below support, below the recent low, below a key moving average. Not a random percentage.
- Size your position based on the stop, not the stock price. If your stop is $2 away from your entry and you're willing to risk $100 on the trade, you buy 50 shares. This is position sizing, and it's the most underused tool in retail trading.
- Maintain a minimum 2:1 risk-reward ratio. If you're risking $1, your target should be at least $2. This means you can be wrong half the time and still make money.
- Cut losers fast. Getting stopped out is not failure — it's the system working. Revenge trading (re-entering a losing position out of frustration) is where accounts go to die.
- Let winners run. The asymmetry of swing trading works only if you don't exit winners early out of fear while letting losers run out of hope. That's the exact wrong behavior, and almost every new trader does it.
For a structured way to evaluate your trade setups before you enter, the free expectancy calculator shows you whether your historical win rate and risk-reward ratio actually produce a positive expected value over time.
Common Mistakes New Swing Traders Make When Picking Stocks
The most common mistake is chasing price — buying a stock after it's already moved 15-20% because it showed up on a trending list. By the time a stock is trending on social media, you're not early. You're the exit liquidity for whoever got in three days ago.
The full list of predictable mistakes:
- Ignoring the broader market trend. Swing trading against the primary trend is catching a falling knife. Most stocks follow the index. If the S&P 500 is in a downtrend, your long setups have a headwind regardless of how good the chart looks.
- Overtrading. More trades do not mean more profits. They mean more commissions, more exposure to random noise, and more opportunities to make emotional decisions. Fewer, higher-quality setups beat a high volume of mediocre ones every time.
- Skipping the stop loss. "I'll just watch it" is how $500 losses become $2,000 losses. The stop loss is not optional.
- FOFO — Fear of Finding Out. This is the trader who refuses to check their account after a bad day, avoids reviewing their trades, and never builds a feedback loop. If you don't know why you lost, you'll lose the same way again.
- Confusing a dead cat bounce with a reversal. A dead cat bounce is a brief recovery in a declining stock that quickly resumes its downtrend. It looks like a setup. It isn't. Require volume confirmation before trusting any bounce.
- Overcomplicating the setup. Five indicators, two timeframes, and a Discord alert don't make a better trade. A clean setup on one timeframe with volume confirmation beats a complicated multi-signal mess every time. Systems over hacks.
How to Avoid Getting Caught in a Stock Trap When Swing Trading
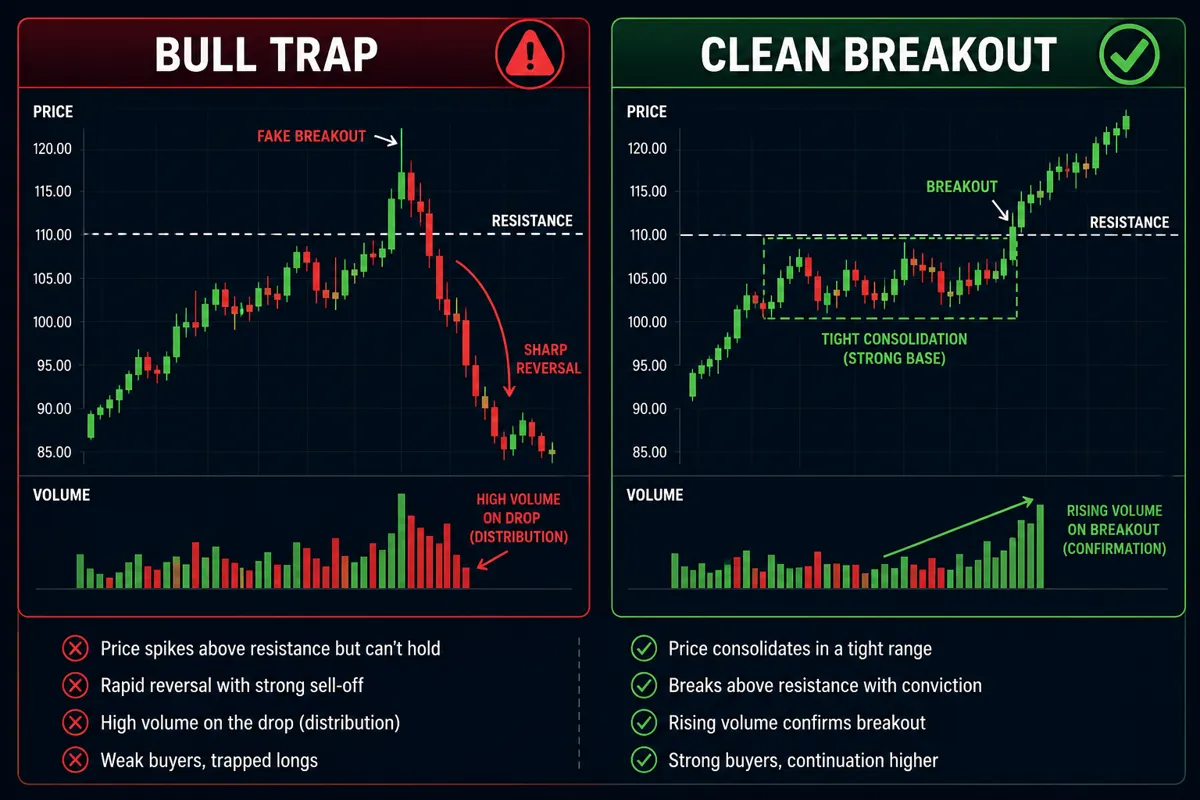
A stock trap — most commonly a bull trap — happens when price breaks above resistance, draws in buyers, then reverses sharply back below the breakout level. The buyers who chased the breakout are now underwater, and the stock often falls further as they exit.
How to avoid it:
- Wait for the close. A stock that breaks above resistance intraday but closes back below it is a failed breakout. Don't enter on the intraday spike; wait for a confirmed daily close above the level.
- Check volume on the breakout. A breakout on weak volume is a red flag. The move doesn't have institutional participation behind it.
- Avoid overextended stocks. If a stock has already run 30-40% in two weeks, the risk-reward for a new entry is poor. The move is likely overextended. Wait for the next base to form.
- Know where the next resistance is. If a stock breaks out but runs directly into a major resistance level two percent higher, the trade has almost no room. Measure the distance to the next ceiling before entering.
The Stock Health Scorecard is a useful tool for quickly assessing whether a candidate has the fundamental and technical profile to support a swing trade — or whether it's a trap dressed up as a setup.
Are There Online Communities or Forums That Share Early Stock Signals
Yes, but use them carefully. Reddit's r/swingtrading, StockTwits, and various Discord servers share real-time trade ideas — some useful, most noise. The problem isn't the communities themselves; it's the incentive structure. Anyone posting a ticker publicly has already entered the position. You are not getting early access; you're getting their exit strategy.
What actually works:
- Use communities for idea generation, not trade execution. If a name shows up in a forum, add it to your watchlist and run it through your own screening process.
- Follow traders who show their full trade history — entries, exits, and losses — not just their wins.
- Paid services that provide structured swing trade candidate lists (with methodology explained) are more useful than free Discord alerts, because accountability exists.
The signal-to-noise ratio in most trading communities is brutal. Cut the noise, keep the alpha. Build your own process, use communities as one input among many, and never enter a trade solely because someone on the internet told you to.
What Percentage Return Should You Expect from a Typical Swing Trade
A realistic swing trade targets a 3-10% gain over two to ten days, with a stop loss set at 1-3% below the entry. This produces the 2:1 to 3:1 risk-reward ratio that makes the math work over a large sample of trades.
The honest math: If you win 50% of your trades with a 2:1 risk-reward, you're profitable. If you win 40% of your trades with a 3:1 risk-reward, you're still profitable. The percentage of winning trades matters far less than the ratio of average wins to average losses.
What you should not expect: consistent 20-30% gains per trade. Those exist, but they're not the base case, and building a strategy around outlier outcomes is how accounts blow up. The traders who survive long-term are the ones who accept 5% wins repeatedly, not the ones who swing for 50% and get stopped out constantly.
Never let anyone — a tool, a service, or a social media account — promise you specific returns. That's not how markets work, and it's not how this site operates. Data over noise, process over prediction, always.
Tools and Software That Help Find Swing Trade Candidates Quickly
The right tool stack for swing trading in 2026 doesn't need to be expensive or complicated. Three to four tools covering screening, charting, and trade tracking is enough.
Core stack for most swing traders:
- Finviz (free/Elite): Daily screening for momentum stocks using fundamental and technical filters. The visual heatmap is genuinely useful for sector rotation analysis. Finviz tool review.
- TrendSpider: Automated chart analysis, trendline alerts, and daily scanner emails. Particularly strong for traders who want AI-assisted pattern recognition without building their own algorithms. TrendSpider review.
- TradingView: Charting and community screener. The standard platform for a reason. TradingView comparison.
- Option Alpha: Useful for traders who want to add options-adjacent swing setups — covered calls on swing positions, or defined-risk spreads around earnings. The automation features let you set rules-based entries and exits. Option Alpha breakdown.
- Trade Ideas or Blackbox Stocks: Real-time AI scanners for unusual activity and momentum signals. Better for active traders who want live alerts during market hours.
For a full side-by-side comparison of 100+ AI trading tools across categories, the AI trading platform directory is the fastest way to find what fits your budget and workflow.
Conclusion: Build the System, Run It Daily, Let the Setups Come to You
Here's the uncomfortable truth about how to find stocks for swing trading before everyone else does: it's not a secret scanner, a premium Discord, or a proprietary AI signal. It's a daily process that most traders are too impatient or too distracted to run consistently.
The traders who find good setups early do the same things every day. They filter for liquidity. They screen for relative strength and momentum. They confirm with volume. They check the chart structure. They build a watchlist. They wait for the setup to come to them instead of chasing price.
That process takes thirty to sixty minutes the night before the market opens. It's not glamorous. It doesn't make for good social media content. But it's what discipline beats prediction actually looks like in practice.
Your action plan starting tonight:
- Open Finviz (free) and set these filters: price above $10, average volume above 500K, RSI between 50-70, price above the 50-day moving average.
- Sort the results by relative performance over the past month.
- Take the top 10 names and pull up their daily charts. Look for tight consolidation near a recent high with volume drying up on the pullback.
- Add the two or three cleanest setups to your watchlist with a defined entry price, stop loss, and target.
- Paper trade it first for two weeks before using real money.
That's it. Systems over hacks. Process over prediction. Signal over noise.
Want the tools and setups behind this, without the hype? Start at aistockpickerapp.com.
FAQ
What is the best time frame for swing trading stocks?
The daily chart is the primary timeframe for most swing traders. It filters out intraday noise and shows the multi-day trends that swing trades are designed to capture. Some traders use the weekly chart to identify the larger trend and the daily chart to time the entry.
How many stocks should be on a swing trade watchlist?
Five to fifteen stocks is a practical range. Fewer than five limits your opportunities; more than fifteen creates decision fatigue and makes it hard to monitor each setup properly. Quality over quantity.
Can you swing trade with a full-time job?
Yes. Swing trading is one of the few active strategies compatible with a day job because you do your analysis the night before and set limit orders or alerts. You don't need to watch the market all day.
What is the difference between a breakout and a bull trap?
A breakout is when price clears a resistance level on high volume and continues higher. A bull trap is when price briefly clears resistance on weak volume, draws in buyers, then reverses back below the level. Waiting for a confirmed daily close above resistance reduces the risk of entering a trap.
Is swing trading better than day trading for beginners?
For most beginners, yes. Swing trading requires less screen time, is not subject to the pattern day trader rule at lower account sizes, and gives you more time to think through decisions. Day trading demands split-second execution and full-time attention.
How do I know when to exit a swing trade?
Exit at your predetermined target, when price hits your stop loss, or when the original reason for the trade is no longer valid — for example, if the stock breaks below a key moving average or volume patterns shift from accumulation to distribution.
What sectors tend to produce the best swing trading opportunities?
Technology, healthcare, and consumer discretionary have historically produced strong momentum setups. The