Finviz Screener Settings for Swing Traders | Copy These 7 Filters
The Finviz screener can cut every US-listed ticker down to a short watchlist in a couple of minutes, and all seven filters below work on the free plan. That is the whole point of these Finviz screener settings for swing traders: copy these 7 filters, run them for a week, then adjust one at a time.
Quick Answer
The best Finviz screener settings for swing trading stack three things in order: liquidity, trend, then timing. Set average volume above 500K, price above $5, market cap mid or larger, price above both the SMA50 and SMA200, relative volume above 1.5, and one sector or pattern filter. The Finviz free version runs all of that on delayed quotes at $0. Finviz Elite adds real-time data, backtesting and Excel export for $39.50 a month, or $299.50 a year, which works out to $24.96 a month billed annually.
Quick pick: screeners for swing traders
- Finviz Elite Best for fast daily swing screening and export. From $39.50/mo.
- TradingView Essential Best for charting the names you screened. From $12.95/mo billed annually.
- Stock Rover Premium Best for deep fundamental screening. From $29/mo.
Skip it if: you want someone to hand you stock picks instead of building your own screens.
Key Takeaways
- Seven filters is the practical ceiling. Add an eighth and the Finviz screener starts returning three names or zero.
- Average volume above 500K shares and a $5 price floor remove the illiquid tape most swing traders get stuck in, a standard echoed in Finviz swing scan walkthroughs.
- Price above the 50-day and 200-day SMA is the trend filter. Both moving averages sit in the Technical tab of the official Finviz screener help docs.
- Finviz free is $0 with delayed quotes. Elite is $39.50 monthly or $299.50 yearly per Finviz.com/elite.
- Stock Rover Premium runs $29 a month with a 14-day free trial, per stockrover.com/plans.
- Reddit user u/hywayrobber: "I use Finviz to screen for fundamentals and thinkorswim to view technicals."
- These settings are a starting template built from Finviz's own filter menu, not a tested system. Paper trade it first.
What are the best Finviz screener settings for swing trading?
The best settings filter in one order: liquidity first, trend second, timing last. Liquidity decides whether you can get out, trend decides which direction you are even allowed to trade, and timing decides whether today is the day. Reverse that order and you end up staring at a thin low float name with a beautiful chart and no bid.
What is the Finviz screener and how does it work?
Finviz is a stock research hub with a screener bolted to the front of it. You stack filters, the Finviz screener returns matching tickers from the NYSE, Nasdaq and AMEX, and you flip between result views to see different columns for the same list.
Those views matter more than most beginners realize. Overview, Valuation, Financial, Ownership, Performance and Technical all show the same filtered stocks with a different column set, so one screen can answer a fundamentals question and a price question without re-running anything.
Finviz screener settings explained: the filter tabs
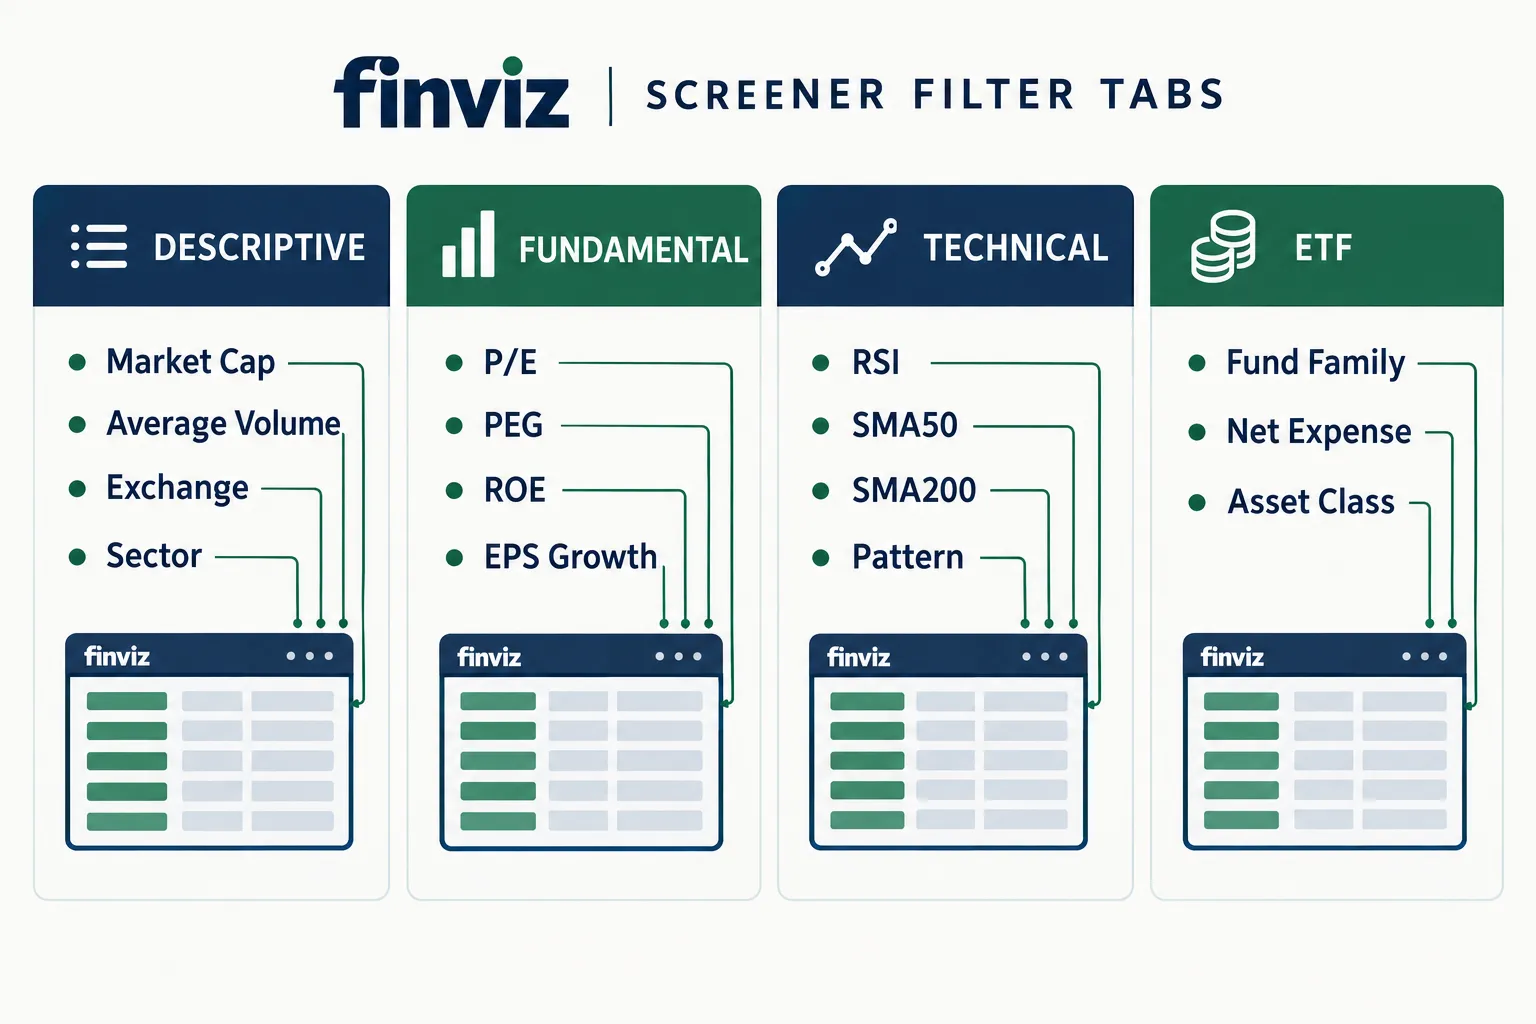
Filters live in four groups: Descriptive, Fundamentals, Technical, and an ETF tab. Descriptive holds market cap, average volume, price, exchange and sector. Fundamentals holds PEG, ROE, margins and growth. Technical holds RSI, moving averages, relative volume and pattern recognition signals.
Decision rule: swing traders should spend four of their seven filters in Descriptive and Technical. Fundamentals are a tiebreaker on a two to ten day hold, not a trigger.
Finviz screener: which filters matter most?
Volume and price filters matter most, because they decide whether every other filter is even tradeable. A perfect setup on 60,000 shares a day is a trap. Get liquidity right and the rest of the Finviz screener is tuning.
Volume filters, explained in plain English:
- Average Volume is the typical daily share count. Set it over 500K. Multiply by price to get dollar volume: 500K shares at $20 is $10 million changing hands daily, which is enough for a retail position to enter and exit without moving the tape.
- Relative Volume compares today to the average. Above 1.5 means something is happening right now. Step-by-step Finviz video walkthroughs lean on this filter for exactly that reason.
- Price is your junk filter. Over $5 removes most sub-penny chop and keeps names your broker will margin.
Price change is the one volume cousin people abuse. Screening for a 10% daily move finds stocks that already ran. You are buying the gap, not the setup.
Step by step: which 7 filters should you copy?
Copy these seven in this order. They come straight from Finviz's own filter menu, which means you can rebuild the screen in two minutes from scratch if you lose it.
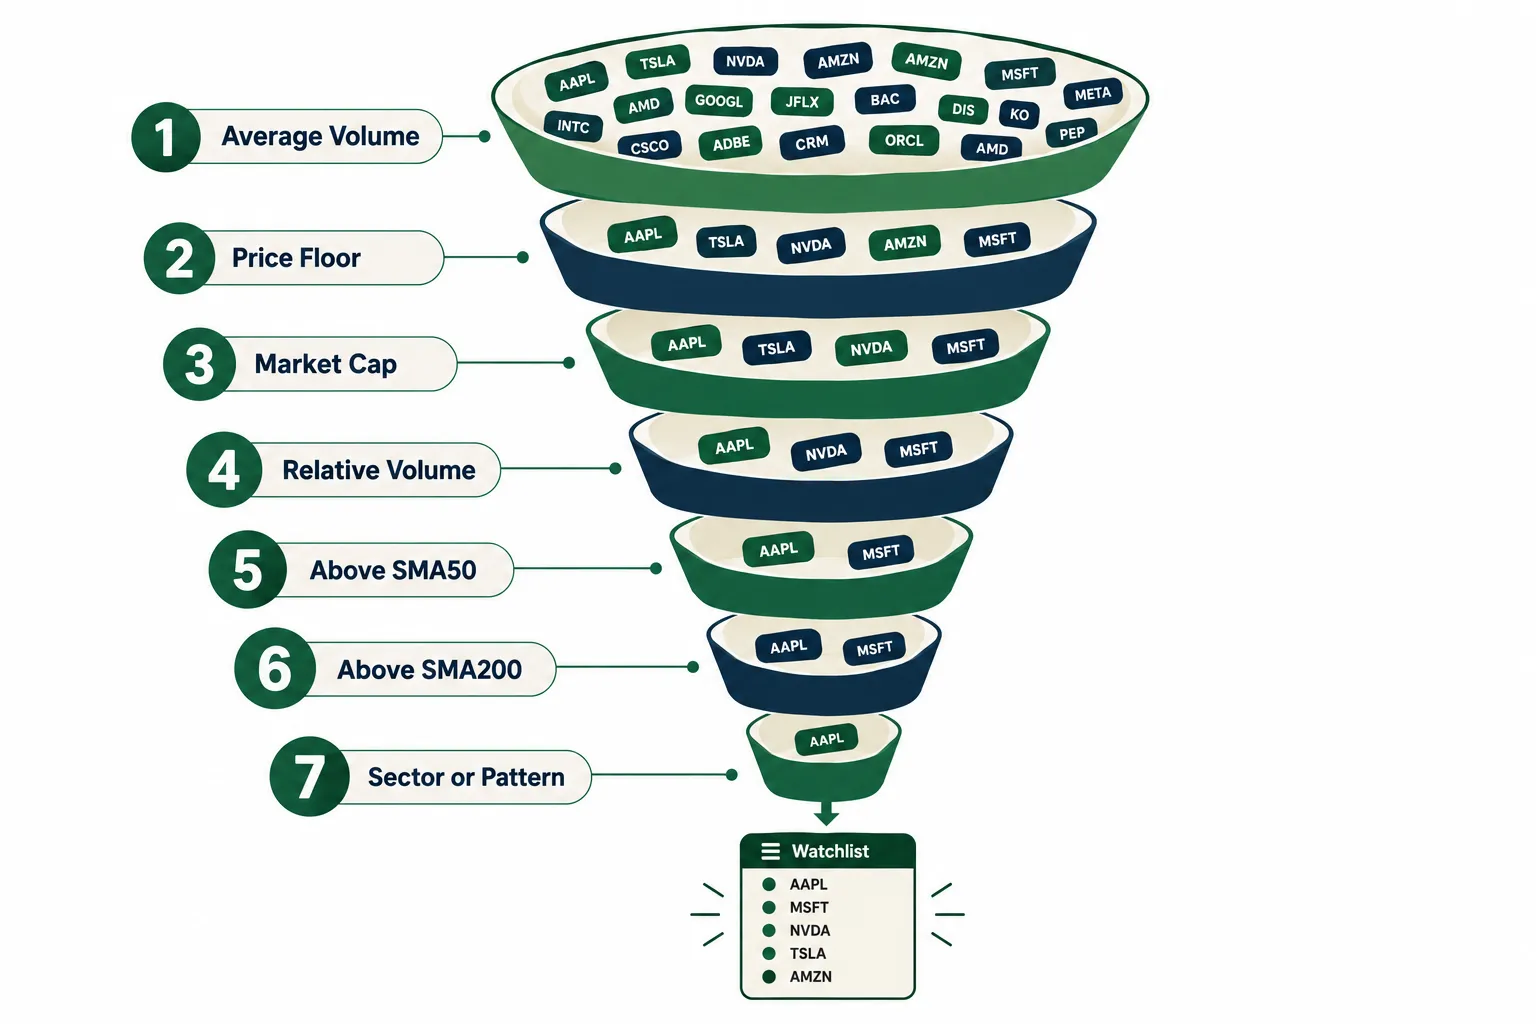
- Average Volume: Over 500K. Liquidity floor. Push it to 1M if your position size is above $10,000.
- Price: Over $5. No penny stocks. A $5 floor is the usual starting point in published swing trading guides that use the Finviz stock screener.
- Market Cap: Mid ($2bln to $10bln) or Small+ ($300mln and above). Mid caps move enough to be worth a swing and have enough float to be sane.
- Relative Volume: Over 1.5. Today's participation. This is your timing filter.
- Price above SMA50. Intermediate trend. The trend is your friend until it is your landlord.
- Price above SMA200. Long-term trend. Both SMA filters sit in the Technical tab.
- Sector or Pattern. Either pick one sector, Technology being the usual suspect, or use a pattern recognition signal like Channel Up or Horizontal S/R to find tight consolidation instead of overextended names.
Flip filter 6 to "Price below SMA200" and you have a short screen. Same skeleton, opposite bias.
How do you save and use Finviz screener filters?
Without an account, your screen lives in the URL, so bookmark it. A free registered account lets you save screener presets, and Elite adds email alerts when new names hit the filter set. If you typed "screener Finviz" into Google and landed on the homepage, the tool itself sits under the Screener tab.
Finviz also lets you build chart templates once and apply them everywhere. Their custom chart template release applies the same layout across screener charts, stock pages and groups, which beats re-adding the same moving averages every session.
Day traders vs swing traders: what changes?
If you are hunting for the best stock screener for day trading, the same tool works with different settings. Day traders tighten everything and drop the trend filters. Average volume over 1M, relative volume over 2, price change over 3%, shortable, optionable, and a $5 to $100 price band. Swing traders keep the SMA filters and loosen relative volume, because the setup you want is basing quietly, not already ripping.
What stocks does this screen actually find?
Mostly mid and large caps in whatever sector is leading, names already in an uptrend with fresh volume behind them. The size of the list is a signal too. A very long list means the market is in a broad rally and your filters are too loose. A handful of names means a choppy tape, and that is information.
What does the Finviz screener miss?
Plenty. Finviz is a fast filter, not a research department. No options Greeks, no built-in journal, no position sizing, and fundamental data depth that trails dedicated stock research tools.
Common mistakes with the Finviz screener
- Stacking 14 filters. You get three results and call it an edge. It is overfitting.
- Screening once a month. The whole value is a daily watchlist.
- Ignoring news. The Finviz news feed is on every ticker page for a reason. A filter cannot see an SEC filing.
- Treating the output as a buy list. It is a research queue. Run your own entry and exit plan with a swing trade position size calculator before you commit capital.
Finviz screener not showing results? How to fix it
Zero results is almost always filter conflict. Remove filters in reverse order, newest first, until names reappear. The usual culprits: an RSI band set too narrow, a market cap tier that excludes your sector, or price above SMA50 combined with a negative price change on the same day.
How often does the Finviz screener update, and does it work on mobile?
Free runs on delayed quotes. Elite runs real-time data with intraday screening and refresh intervals, which is the single biggest difference between the two tiers. The web app works in a phone browser, and the layout is usable, but reading a 40-column Technical view on a 6-inch screen is a fast path to analysis paralysis.
Is Finviz free, and what does Elite add?
Yes, the Finviz free stock screener costs $0 for registered users with delayed quotes, per Finviz's own Elite pricing page. Elite adds real-time data, premarket and after-hours quotes, backtesting, advanced charts, alerts, and Excel and CSV export for $39.50 a month or $299.50 a year.
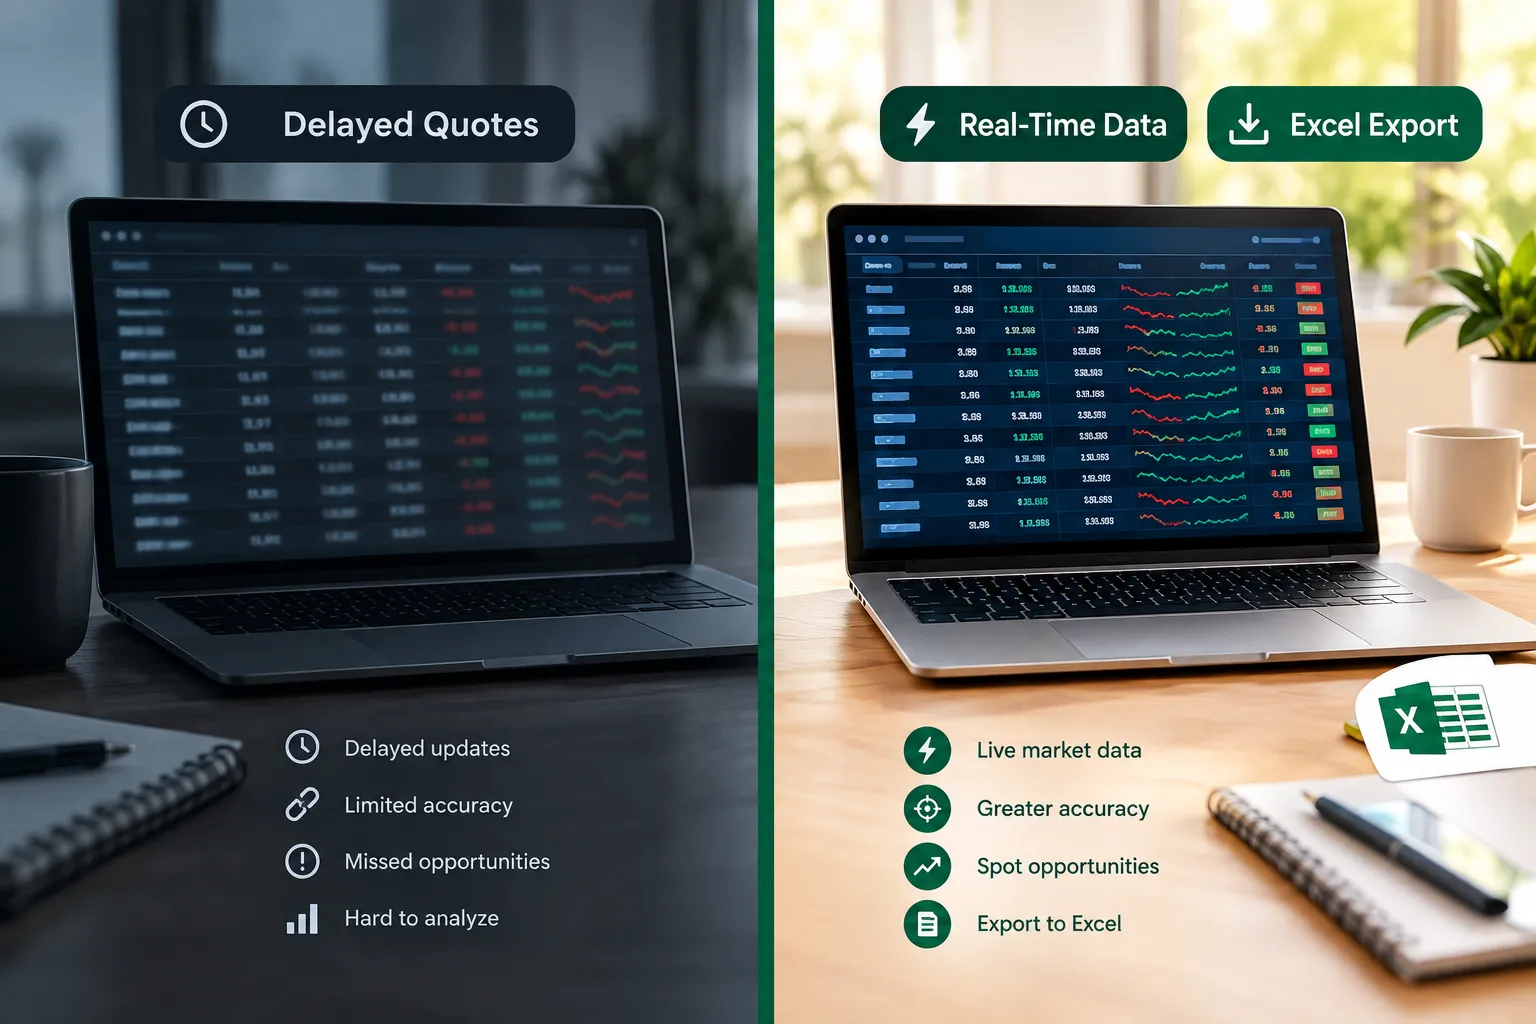
What free gets you: every filter in the screener, pattern recognition, maps, groups, news, and all six result views. For a swing trader screening after the close, free covers roughly the whole job.
What Elite adds that actually changes behavior: real-time screening during power hour, alerts, and export. The breakeven math is blunt. Annual Elite costs $24.96 a month. If one avoided bad entry a month saves you $25, it pays. If you screen twice a week on delayed data and trade three times a month, free is the honest answer. We broke the tiers down further in Finviz Elite vs free: what you actually lose without the upgrade.
Finviz screener vs thinkorswim vs TradingView: which is best?
For raw screening speed, Finviz. For charting the result, TradingView. For executing on a real-time scan without a second subscription, thinkorswim. Most working swing traders use two of the three and stop pretending one tool does everything.
- Finviz: fastest filter-to-list workflow, weakest charting.
- TradingView: best charts and alerts. Free users have reported screener edits moving behind the paywall in the r/TradingView thread "Screener is paid now?", so check TradingView pricing before assuming free covers it.
- thinkorswim: real-time scans and options Greeks in the same window, but the Scan tab has a steeper learning curve than the Finviz screener.
If you only read one comparison, read Stock Rover vs Finviz: which screener gives you more for your money. Stock Rover vs Finviz: Finviz wins on speed, Stock Rover wins on depth.
What do real users say about the Finviz screener?
Swing traders on Reddit keep saying the same two things: the Finviz screener is easier than the alternatives, and it belongs in a stack rather than alone.
"In fairness the Finviz scanner is much better and easier to use than the TV scanner."
u/ZekeTarsim, r/swingtrading
"I use Finviz to screen for fundamentals and thinkorswim to view technicals."
u/hywayrobber, r/swingtrading
Stock Rover gets a sharper edit from one Trustpilot user: "The site is like 15 years behind." Depth and design are different products.
What are the best alternatives to Finviz?
The right alternatives to Finviz depend on what you want to screen for, how fast you need it, and whether you want filters or finished picks.
For better charting: TradingView
TradingView starts at $0 on Basic and $12.95 a month on Essential billed annually. Drawbacks: screener features have shifted behind paid tiers, and its scan logic is clunkier than Finviz for a quick daily pass.
For fundamental research: Stock Rover
Stock Rover Premium is $29 a month, Premium Plus is $49, both with a 14-day free trial. Drawbacks: a dated interface that frustrates traders used to modern dashboards, and screens built for fundamentals, not intraday timing.
For professional-grade data: Koyfin
Koyfin is the closest retail analog to a terminal for macro and institutional-style dashboards. Drawbacks: screening is not its strength, and the learning curve is real for a beginner.
For stock picks instead of screening: Stock Advisor and Alpha Picks
If you do not want to screen at all, picks services sell the opposite product. Motley Fool Stock Advisor sends long-term recommendations, and Seeking Alpha's Alpha Picks runs a quant-driven monthly list. Two drawbacks apply to both: you see less of the method than you would in your own screen, and you are renting someone else's process instead of building yours.
If you want to compare Stock Advisor, Alpha Picks and a screener, the difference is simple. A screener teaches you to find setups. A picks service hands you a ticker and no process. We sorted both categories in the AI stock screeners directory and in 7 swing trade scanners that find setups before they break out.
Final verdict: Finviz Elite worth it?
Final verdict: Finviz is the best free stock screener for swing traders, and Elite is worth it only once real-time data changes a decision you are already making. The free version does 80% of the job for a trader who screens after the close.
What Finviz does well: instant filter-to-watchlist speed, pattern recognition, clean views, and a free tier that embarrasses most paid stock research tools.
What Finviz lacks: real-time data on free, weak charting, no options Greeks, no journaling, and fundamental depth that Stock Rover beats outright.
Ideal users: swing traders, sector rotators, and self-directed investors who want their own filters. Who should skip it: scalpers who need millisecond data, options traders who need Greeks, and anyone who wants finished picks instead of screening. Beginners should start free, keep the seven filters, and build the habit before paying anyone. Need help structuring the hold? Start with our swing trading tools hub, and if you trade contracts, see the 7 options screener filters that matter.
How do you turn the screen into a nightly routine?
A screen is only worth what you do with it after the close. Run the seven filters once the market shuts, when delayed quotes no longer matter. Open each chart and throw out anything with earnings inside your holding window, a gap you would have to chase, or no clear level for a stop.
- Screen. Run the saved filter set and sort by relative volume.
- Cut. Keep five names or fewer. A watchlist of 30 is a second job.
- Plan. Write the entry, the stop and the size for each name before the open.
- Review. At the end of the week, note which filter let in the losers and adjust one setting, never three.
That loop is the product. The filters only feed it.
Systems over hacks. Seven filters you understand beat 20 you copied.
Stop guessing which screener fits your swing setup. We sorted 200+ AI stock tools by strategy, price and what they actually do, so you get a short list in one read.
See the screener shortlist: aistockpickerapps.com/screeners
FAQ
Is Finviz a good screener?
Yes. Finviz is one of the fastest filter-to-watchlist screeners available, with full Descriptive, Fundamentals and Technical filter sets plus pattern recognition. It is weaker on charting, fundamental history and options data than Stock Rover or thinkorswim. For a daily swing screen, most traders find Finviz quicker and simpler than the alternatives.
Is Finviz screener free?
Yes. The Finviz screener is free at $0 for registered users, with delayed quotes and access to every filter category. What you lose is real-time data, alerts, backtesting and Excel export, all of which sit in Finviz Elite at $39.50 a month or $299.50 a year per Finviz's official Elite page.
Which is better, Finviz or TradingView?
Finviz is better for screening, TradingView is better for charting and alerts. TradingView Basic is $0 and Essential is $12.95 a month billed annually, while Finviz free covers the whole screener. Reddit swing traders consistently call the Finviz scanner easier to use. Many run both: screen in Finviz, chart in TradingView.
What is the best free stock screener?
Finviz free is the strongest free stock screener for swing traders because every filter stays unlocked at $0. Yahoo Finance offers a simpler free screener with fewer technical filters, and TradingView Basic is free but has moved some screener editing behind paid tiers. For free technical screening, Finviz leads.
Can beginners use the Finviz screener?
Yes. Start with three filters, not seven: average volume over 500K, price over $5, and price above the SMA50. Run it nightly for two weeks before adding anything. Beginners who stack 12 filters on day one get empty results and quit. Our screener criteria builder helps structure the first screen.
Does Finviz have real-time data?
Only on Elite. The free plan uses delayed quotes, which is fine for screening after the close but not for intraday entries. Finviz Elite adds real-time data, premarket and after-hours quotes, and intraday refresh for $39.50 monthly or $24.96 a month when billed annually at $299.50 per year.
Prices move faster than your stop loss, so confirm every number on the official pricing page before you pay.
This is education, not financial advice.
Your market edge starts with the right tool. Stay alpha.
Some links in this article are affiliate links, which may earn us a commission at no extra cost to you.