Free Stock Charts: TradingView, Finviz and Yahoo Compared
Last updated: August 30, 2026
Quick Answer: Free stock charts are genuinely capable in 2026, but the real cost is not money. It is a 15 to 20 minute data delay on US equities and a hard cap on how many indicators you can run at once. TradingView leads on charting depth, Finviz leads on screening, and Yahoo Finance leads on accessibility. Which one you need depends entirely on what you are trying to do.
Key Takeaways
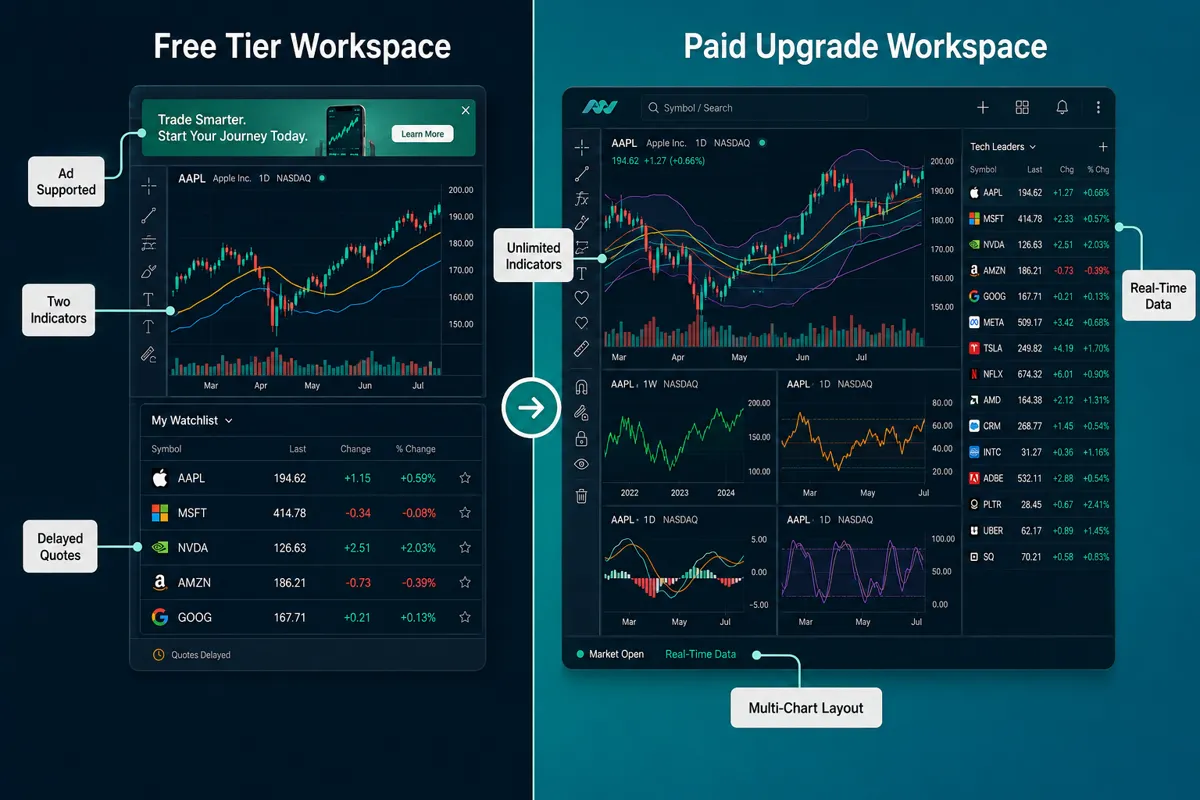
- TradingView's free tier limits users to two indicators per chart and one chart per tab, with US stock data delayed unless you purchase a separate real-time data package
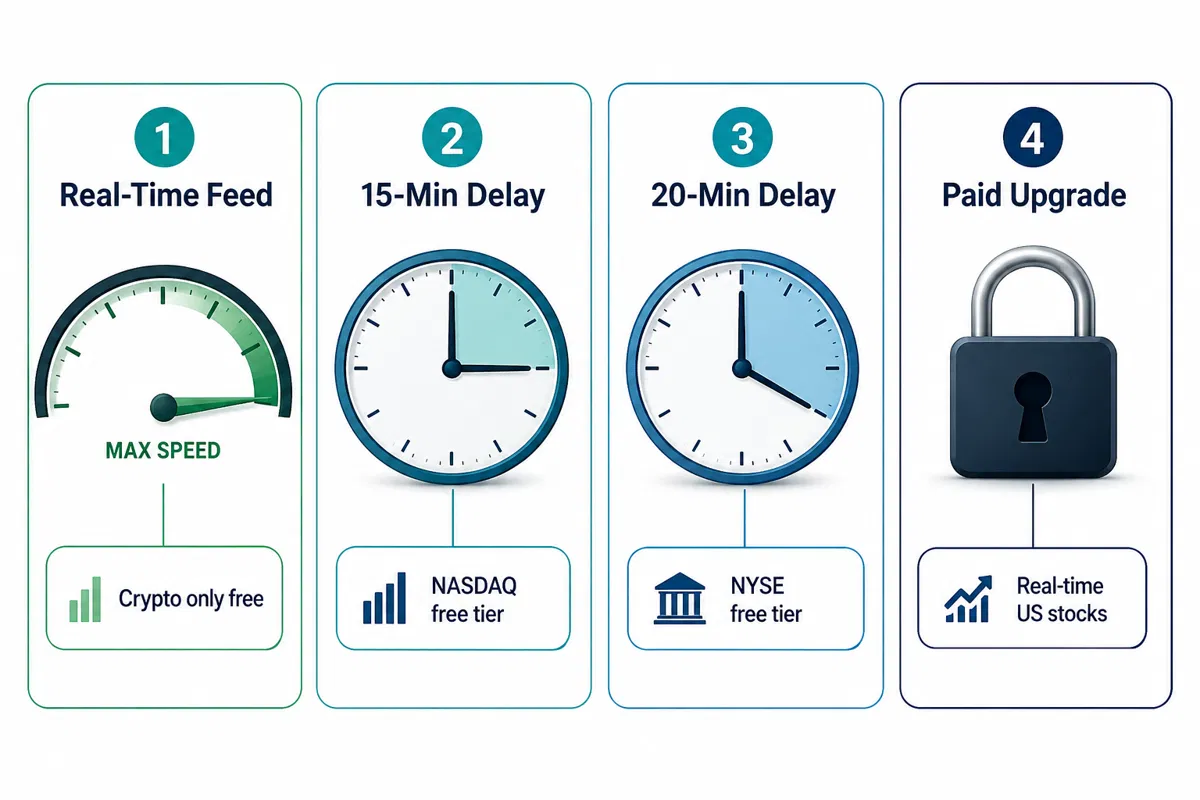
- Finviz free delivers 15-minute delayed quotes on NASDAQ and 20-minute delayed quotes on NYSE and AMEX, while ELITE adds real-time quotes and extended-hours data
- Yahoo Finance provides basic free stock charts with delayed data, aimed at everyday investors rather than active traders
- Crypto data on TradingView streams in real time for free because crypto exchanges do not charge the same licensing fees as US equity exchanges
- TradingView was ranked the best free stock chart website in a 2026 comparative review by StockBrokers.com, with Yahoo Finance and Finviz also reviewed for chart quality and quote freshness
- Free stock charts with indicators are available on TradingView, but the two-indicator cap forces a choice between moving averages, RSI, MACD, or volume overlays
- Upgrading to Finviz ELITE adds drawing tools, SMA and Bollinger overlays, RSI, MACD, automatic pattern recognition, and multiple chart layouts
What Do Free Stock Charts Give You, and Where Do They Stop?
Free stock charts give you price history, basic candlestick views, volume data, and a handful of indicators. What they almost never give you, without paying extra, is a live feed of US equity prices.
Free Real-Time Stock Quotes vs Delayed Quotes
The gap between a real-time quote and a delayed quote is not a minor inconvenience. For a swing trader checking a weekly chart, 15 minutes of lag barely registers. For anyone trying to time an entry on a breakout, that same delay is the difference between a clean setup and chasing a move that already happened.
US exchanges, including NYSE and NASDAQ, charge data licensing fees to anyone who redistributes their prices. That cost gets passed to users. Most free chart platforms absorb the cost by defaulting to delayed data and charging for real-time access as an add-on. This is not a platform decision. It is an exchange rule, and every free charting tool works around it the same way.
Why Stock Prices Real Time Free Is Rarer Than It Looks
Crypto is the exception. Because decentralized exchanges do not carry the same licensing structure as regulated US equity markets, TradingView streams crypto data in real time on its free plan. That is why a Bitcoin or Ethereum chart on TradingView feels snappier than a chart for a NYSE-listed stock on the same account.
For US equities, free real-time stock quotes exist in one scenario: brokers sometimes offer real-time data to account holders as a benefit of having a funded account. If you already trade through a broker like Fidelity or Webull, check whether their built-in charts carry real-time data before paying for a separate charting subscription.
TradingView: The Best Free Stock Charts, With Two Hard Caps
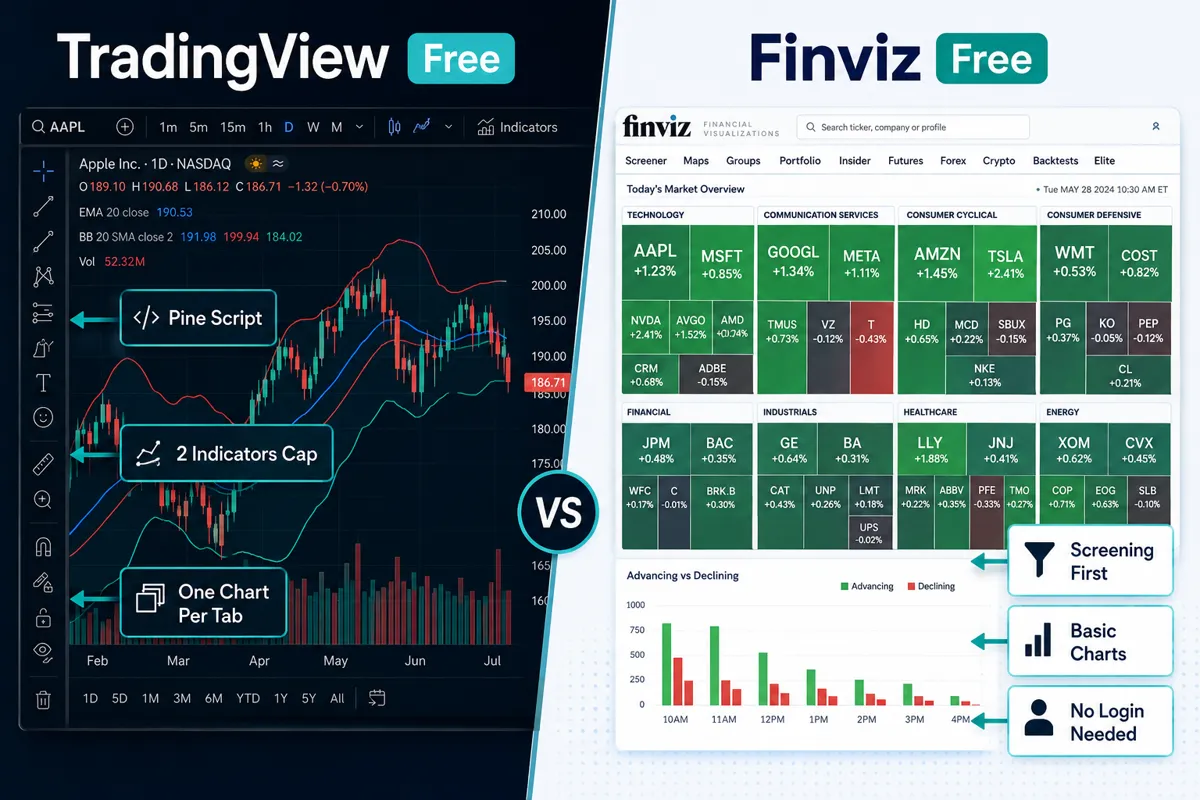
TradingView is the strongest free charting platform available in 2026. Its charting engine, Pine Script scripting language, and community library of published indicators are genuinely best-in-class. The free tier is constrained by two specific limits: two indicators per chart and one chart per tab.
TradingView Free Stock Charts and the Indicator Limit
Two indicators sounds like enough until you actually try to build a setup. A basic swing trade read might use a 20-period moving average, a 50-period moving average, RSI, and a volume overlay. That is four indicators. The free plan covers half of them.
This is not a flaw in the charting engine. It is a deliberate constraint designed to push active users toward a paid plan. The engine itself is the same across tiers. What changes is how many tools you can run on top of it simultaneously.
For a beginner learning how to read stock charts, two indicators is actually fine. Pick price action and volume. Master those before adding anything else. The free plan forces good habits by accident.
TradingView Real Time Data: What the Free Tier Streams
TradingView's paid subscription plans do not automatically include real-time US stock data. The platform separates charting plan fees from exchange data fees entirely. A user on a paid plan who has not purchased a real-time data package will still see delayed US equity quotes.
On the free plan, the "Data is delayed" prompt appears directly on the chart. Clicking it opens a path to purchase real-time data for specific exchanges. The exact package price depends on the exchange and whether the user qualifies as a non-professional data subscriber, which carries a lower fee.
Crypto charts, by contrast, stream live on the free plan. If you are charting Bitcoin, Ethereum, or XRP, the free tier gives you real-time price action without any additional purchase.
Using TradingView Indicators Without Paying
The two-indicator cap applies to indicators running simultaneously on a single chart. Published community scripts count toward that limit when active. The workaround is to be intentional: choose two indicators that do the most work for your specific style, and remove them when switching to a different analysis approach.
For technical analysis focused on trend and momentum, a 20-period EMA paired with RSI covers a lot of ground. For support and resistance work, a volume profile or a simple horizontal line tool (which does not count as an indicator) gets the job done. The free plan rewards traders who have already done the thinking about which signals actually matter to their process.
Finviz: The Screener That Draws Charts
Finviz is primarily a stock screener that also renders charts, not a charting platform that also screens. That distinction matters. If your workflow starts with filtering stocks by fundamental or technical criteria and then glancing at a chart to confirm the setup, Finviz free is excellent. If you need to do deep chart analysis with multiple indicators and drawing tools, the free tier is not built for that.
Stock Screener Finviz and Its Free Visual Output
Finviz free gives you access to its screener, a heatmap of the market, basic interactive charts, and no login requirement. The charts are functional but stripped down. You get price history and basic candlestick views. Drawing tools, indicator overlays like Bollinger Bands or MACD, and automatic pattern recognition are all locked behind Finviz ELITE.
The screener itself is the reason most traders use Finviz. Filtering by market cap, sector, P/E ratio, float, and dozens of other criteria is available for free. For a trader building a watchlist before the open, Finviz free handles that job well without requiring an account or a subscription.
Where Finviz Charts Fall Short for Active Trading
Finviz free quotes are delayed by 15 minutes for NASDAQ-listed stocks and 20 minutes for NYSE and AMEX-listed stocks. For active intraday trading, that is not a working data source. A stock can gap, break out, and reverse in 20 minutes on a volatile day.
Finviz ELITE adds real-time stock quotes, extended-hours data from 4:00 AM to 8:00 PM ET, drawing tools, SMA and Bollinger overlays, RSI, MACD, and multiple chart layouts. The upgrade is worth evaluating if Finviz is already your primary screening tool and you want to do chart analysis inside the same platform rather than switching to TradingView for the chart work.
Yahoo Finance: The Free Chart Everyone Already Has
Yahoo Finance delivers free stock charts that are accessible, well-integrated with news and fundamentals, and genuinely useful for investors who are not trying to time intraday moves. It is the easiest entry point for anyone new to reading charts.
What Yahoo Delivers Without an Account
Yahoo Finance provides price charts, basic technical indicators, news headlines, earnings data, and analyst estimates without requiring a login. The interface is familiar to most people because it is the default landing page for stock lookups across the internet. For a beginner learning how to read stock charts, the combination of a chart, a news feed, and fundamental data in one place is a real advantage.
The charts support multiple time frames, from one day to five years, and include a handful of indicator overlays like moving averages and volume. The experience is designed for the everyday investor checking a position, not for a trader building a system.
The Fifteen Minute Delay No Platform Advertises
Yahoo Finance's US equity data carries a delay. The platform does not prominently advertise the exact length, but the standard for free data redistribution under NYSE and NASDAQ licensing is 15 to 20 minutes. Yahoo Finance Plus, the paid tier, offers real-time data as part of its feature set.
For long-term investors and swing traders working off daily or weekly charts, this delay is irrelevant. For anyone trying to see stock charts live and make intraday decisions, Yahoo Finance free is not the right tool.
Comparison Table: TradingView vs Finviz vs Yahoo Finance
Data Delay, Indicator Limits, Watchlists, and Cost
| Platform | Data Delay (US Stocks) | Indicators on Free Plan | Charts per Layout | Cost to Upgrade |
|---|---|---|---|---|
| TradingView | 15 min (real-time add-on available) | 2 per chart | 1 per tab | Essential plan available; real-time data sold separately |
| Finviz | 15 min NASDAQ, 20 min NYSE/AMEX | Basic charts only; no overlays | Single chart view | ELITE plan adds real-time and indicators |
| Yahoo Finance | 15 to 20 min (standard free tier) | Basic MAs and volume | Single chart view | Yahoo Finance Plus for real-time data |
Which Free Stock Charts Are Real Time, and Which Are Delayed?
Among the three platforms compared here, none deliver real-time US equity data on their free plans. Real-time US stock data requires a paid exchange license, and free tiers absorb that cost by defaulting to delayed quotes.
Real Time Stock Charts Free: Who Actually Offers It
TradingView is the closest to a free real-time option for specific asset classes. Crypto charts on TradingView stream live at no cost. For US stocks, ETFs, and options, the data is delayed on the free plan. TSX-listed Canadian stocks and LSE-listed UK stocks follow the same licensing model as US exchanges, so they are also delayed on free tiers.
NASDAQ-listed stocks on Finviz carry a 15-minute delay. NYSE and AMEX-listed stocks carry a 20-minute delay. These are not platform choices. They are the minimum delay periods mandated by each exchange's free data redistribution policy.
Stock Charts Live Free and the Exchange Fee Problem
The reason free stock charts live with real-time US data barely exists comes down to exchange economics. NYSE, NASDAQ, and AMEX charge data vendors a licensing fee to redistribute real-time prices. Those fees are not trivial. Platforms either pass the cost to users as a subscription add-on or absorb it and show delayed data instead.
Brokers are the main exception. Many brokers, including those on major platforms like NYSE and NASDAQ-connected systems, provide real-time data to account holders as part of the trading relationship. If you have a brokerage account, check the platform's built-in charts before paying for a separate charting tool.
When a Fifteen Minute Delay Does Not Matter
A 15 to 20 minute delay is irrelevant for most swing trading and investing workflows. If you are analyzing a weekly chart to find stocks in a long basing pattern, the price from 20 minutes ago and the price right now are functionally identical for your decision. The delay only becomes a real problem when the time frame of your trade is shorter than the delay itself.
Day traders and scalpers need real-time data. Swing traders working off daily charts do not. Position traders and long-term investors checking monthly charts definitely do not. Free stock charts are a perfectly valid tool for the majority of retail traders who are not executing intraday.
Do You Need Free Stock Charts With Indicators?
Free stock charts with indicators are available on TradingView's free plan, but the two-indicator limit forces a real choice. Most retail traders do not need ten indicators. They need two or three that they understand deeply and trust consistently.
The Indicator Count That Forces an Upgrade
The two-indicator cap on TradingView's free plan becomes a genuine constraint when you are running a system that requires more inputs simultaneously. A setup that uses a trend-following indicator, a momentum oscillator, a volume indicator, and a volatility band needs four slots. The free plan gives you two.
This is where analysis paralysis starts. More indicators do not produce better trades. They produce more reasons to hesitate. The two-indicator cap is actually a useful forcing function for beginners: it makes you decide what matters before you can add anything else.
Which Indicators Are Worth the Slot
For most technical analysis workflows on free stock charts, the two most useful indicators are a moving average (20 or 50-period EMA for trend direction) and RSI (for momentum and overbought/oversold readings). Volume is visible by default on most platforms without counting as an indicator slot.
If you trade support and resistance levels, horizontal lines and trend lines are drawing tools, not indicators. They do not count against the cap on TradingView. The free plan is more capable than the indicator limit suggests once you account for what drawing tools can do independently.
How to Read Stock Charts on a Free Platform
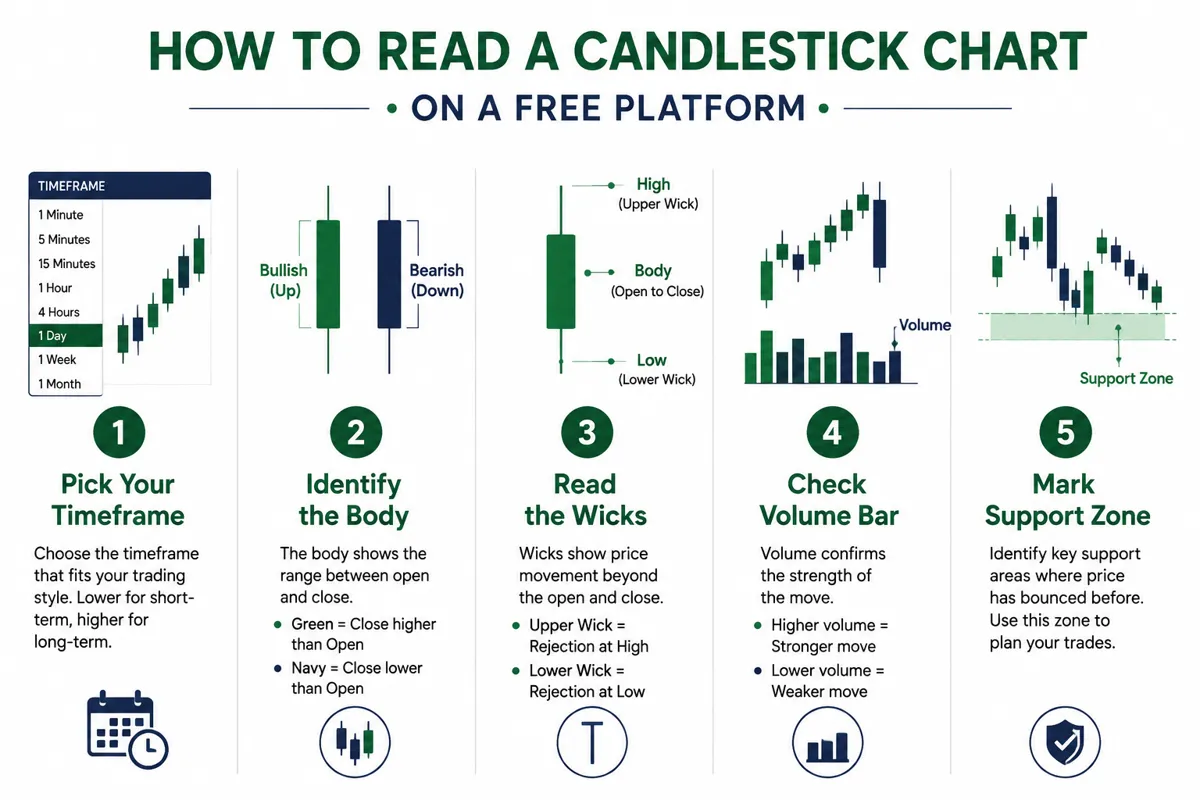
Reading a stock chart starts with three elements: price, time, and volume. Every other layer of analysis builds on top of those three. A beginner who understands candlestick structure, time frames, and volume context can extract more signal from a free chart than an overloaded trader with fifteen indicators running.
Timeframes, Candles, and Volume
A candlestick shows four prices for a given time period: the open, the high, the low, and the close. The body of the candle is the range between open and close. The wicks show how far price moved beyond that range before pulling back. A long upper wick on a bullish candle means buyers pushed price up but sellers pushed it back down before the period closed. That is information about who is in control.
Time frames change what you see. A daily chart shows one candle per trading day. A weekly chart compresses five days into one candle. Swing traders typically work off daily and weekly charts. Day traders work off one-minute to fifteen-minute charts. The free plans on all three platforms support multiple time frames.
Volume confirms price moves. A breakout above resistance on high volume is more reliable than the same move on thin volume. Volume data is available on all three free platforms without counting against any indicator limit.
Setting Up a Clean Workspace on a Free Plan
On TradingView free, the practical setup is: one chart per tab, two indicators chosen deliberately, and drawing tools for marking support and resistance zones. Save the chart layout after setup so you do not rebuild it every session. TradingView allows users to save charts on the free plan.
On Finviz free, the workflow is screener first, chart second. Run a scan to filter stocks by the criteria that match your system, then pull up the basic chart to see the structure. The chart is a confirmation tool in this workflow, not the primary analysis surface.
On Yahoo Finance free, the workflow is research-oriented. Use it to check a chart alongside earnings data, analyst estimates, and news before making a longer-term decision. It is not a trading terminal. It is a research dashboard.
When to Stop Using Free Stock Charts
Free stock charts are the right starting point. They are not the right long-term tool for every trader. The signal that you have outgrown the free tier is specific and behavioral, not just a feeling that you need more features.
Signs You Have Outgrown the Free Tier
You have outgrown the free tier when the indicator limit is actively changing your trading decisions. If you are removing an indicator you trust because you have hit the cap, that is a real cost. If you are making intraday decisions on delayed data and getting stopped out on fills that do not match what you saw on the chart, that is a real cost.
The other signal is time. If you are spending significant time working around platform limitations instead of analyzing market structure, the workaround is costing more than the upgrade. Systems over hacks applies here too.
What Upgrading Actually Buys You
Upgrading TradingView from free to a paid plan primarily buys more indicators per chart, multiple charts per layout, and access to real-time data packages for specific exchanges. The charting engine does not change. The analysis tools do not change. What changes is how many of them you can run simultaneously and whether the price data feeding them is live.
Upgrading Finviz to ELITE buys real-time quotes, extended-hours data, drawing tools, SMA and Bollinger overlays, RSI, MACD, and automatic chart pattern recognition. For a trader who uses Finviz as their primary platform, ELITE is a meaningful upgrade. For a trader who uses Finviz only for screening and TradingView for charting, the free Finviz tier may be sufficient indefinitely.

FullStack Alpha tool
Free Tier Limit Checker
“How much does it cost? I have tradingview.”
TikTok · @karatedad19
Every free charting tier works until it does not. Tick what you genuinely need and find out whether a free plan still covers you, or exactly which wall you are about to hit.
Free tiers change often. Confirm on the vendor's own pricing page before you commit, and never pay annually on a tool you have used for under a month.
Frequently Asked Questions
What are the best free stock charts?
TradingView is the strongest free charting platform for technical depth, offering Pine Script, a large community indicator library, and professional-grade chart structure. Finviz free leads for visual stock screening. Yahoo Finance free is the most accessible option for investors who want charts alongside news and fundamentals in one place.
Are free stock charts real time or delayed?
Most free stock charts show delayed US equity data. Finviz free carries a 15-minute delay for NASDAQ stocks and a 20-minute delay for NYSE and AMEX stocks. TradingView free delays US stock data and requires a separate real-time data purchase for live US equity quotes. Crypto data on TradingView streams in real time for free.
Does TradingView offer free stock charts with indicators?
Yes. TradingView's free plan includes indicators, but caps users at two indicators per chart simultaneously. Community-published scripts count toward that limit when active. Drawing tools like trend lines and horizontal support and resistance markers do not count as indicators and are available without restriction on the free plan.
Where can I get free real-time stock quotes?
Free real-time US equity quotes are not widely available from standalone charting platforms. The most reliable source is a brokerage account: many brokers provide real-time data to account holders at no additional charge. TradingView offers real-time crypto data for free. For US stocks, a real-time data package must be purchased separately even on paid TradingView plans.
Is stock screener Finviz free to use?
Yes. Finviz's screener is free to use without an account and without a subscription. Free users get access to the full screener filter set, the market heatmap, and basic interactive charts. The free tier carries 15 to 20 minute delayed quotes depending on the exchange. Finviz ELITE adds real-time data, drawing tools, and advanced chart indicators.
How many indicators can you use on a free chart?
On TradingView's free plan, the limit is two indicators per chart. Finviz free does not support indicator overlays beyond basic chart views. Yahoo Finance free supports a small set of built-in overlays like moving averages and volume. If you need more than two indicators running simultaneously, TradingView's paid plans or a broker's built-in platform are the practical next steps.
Can I get stock charts live free without an account?
Finviz is the standout option here. It provides charts and screener access without requiring a login or account creation. TradingView allows chart viewing without an account but requires a free account to save charts, set alerts, or access the full indicator library. Yahoo Finance charts are accessible without an account for basic viewing.
How do you read stock charts as a beginner?
Start with three elements: the candlestick body (range between open and close), the wicks (price extremes within the period), and volume (how many shares traded). A daily chart shows one candle per trading session. Look for areas where price repeatedly reversed, those are your support and resistance zones. Add one moving average to identify the trend direction. Keep it simple until those three elements feel automatic.
What are the best free stock charts?
TradingView, Finviz, and Yahoo Finance are the three most widely used free stock chart platforms. TradingView leads on charting depth and technical analysis tools. Finviz leads on visual screening and fast no-login access. Yahoo Finance leads on accessibility and integrated fundamental data. None of them deliver real-time US equity data on their free plans.
What is the best free app for stock charts?
TradingView's mobile app is the strongest free charting app available on both Android and iOS. It carries the same two-indicator limit as the desktop free plan but preserves the full charting engine and Pine Script access. Finviz does not have a dedicated mobile app but is mobile-accessible via browser. Yahoo Finance has a well-rated mobile app that combines charts, news, and portfolio tracking.
Where can I get free charts?
TradingView at tradingview.com, Finviz at finviz.com, and Yahoo Finance at finance.yahoo.com all provide free charts without requiring a paid subscription. Finviz requires no account at all. TradingView and Yahoo Finance offer additional features with a free account registration. Broker platforms like Fidelity and Webull also provide free charts to account holders, often with real-time data included.
Where can I find free real-time stock charts?
Free real-time US stock charts are rare because NYSE and NASDAQ charge licensing fees for real-time data redistribution. The most accessible route is through a brokerage account, where real-time data is often included as an account benefit. TradingView provides real-time crypto charts for free. For US equities, a real-time data add-on is required on TradingView, and Finviz ELITE is needed for real-time quotes on Finviz.
Final Verdict: The Free Chart Stack Worth Running
Free stock charts have genuinely closed the gap with paid tools for most retail trading workflows. The real cost is not a subscription fee. It is a 15 to 20 minute data delay on US equities and a two-indicator cap on the platform with the best charting engine.
The right stack depends on what you are doing. Use TradingView free for chart analysis and technical setups. Use Finviz free for screening and building your watchlist. Use Yahoo Finance free for research, news context, and fundamental checks. None of them require a credit card to start.
If you are day trading with real money and making intraday decisions, the delay is a real problem and a paid real-time data solution is not optional. If you are swing trading off daily charts or investing with a longer time frame, free stock charts are a fully functional tool and the upgrade can wait until the workflow genuinely demands it.
Paper trade it first. Build the process on free tools. Upgrade when the tool is the actual bottleneck, not before.
Two tools compared here. 200+ AI stock tools are catalogued in the FullStack Alpha directory, sorted by category, price and use case. Compare the full field at aistockpickerapps.com.
Affiliate disclosure: FullStack Alpha may earn a commission from some links in this article at no additional cost to you.
References
Tradingview Free Vs Pro - https://quantroutine.com/tools/tradingview-free-vs-pro/
Plan Comparison - https://friendofthetrend.com/tradingview/plan-comparison/
Tradingview Review - https://equitiesindia.com/tools-directory/tradingview-review
Tradingview Review - https://www.financialtechwiz.com/post/tradingview-review/
Tradingview Review - https://arxum.com/tradingview-review/
Tradingview Pro Plans Comparison - https://takeprofitapp.com/en/learn/tradingview-pro-plans-comparison
Finviz Review - https://investorstack.app/research-tools/finviz-review
Finviz Free Vs Elite Is The Upgrade Worth It In 2026 - https://www.insigtrade.com/blog/finviz-free-vs-elite-is-the-upgrade-worth-it-in-2026
Finviz - https://daytradingapp.com/apps/finviz
Finviz Free Vs Elite - https://finviz.com/knowledge-base/getting-started/plans-pricing/finviz-free-vs-elite