Drowning in Screener Filters? This Is the Only Setup You Need
Last updated: June 16, 2026
Quick Answer: Most retail investors fail at stock screening not because they use the wrong filters, but because they use too many. The only setup you need starts with three core filters — market cap, P/E ratio, and return on equity for fundamental screeners, or gap, volume, and price for technical day traders. Save it. Stick to it. Refine it over time. That's the whole system.
Key Takeaways
- Three filters beat thirty. More inputs create analysis paralysis, not better picks.
- The best stock screener settings match your strategy — swing trading, value investing, and day trading each need a different recipe.
- Free tools like Finviz can execute a clean setup immediately; paid tools like TradingView add multi-timeframe depth when you're ready.
- Save your screen as a named template and run it on a consistent schedule — daily for traders, weekly for investors.
- The most common mistake is adding filters every time a trade fails. That's not refinement; that's emotional tinkering.
- Technical indicators work best in screeners when used as a first pass, not a final verdict.
- Warren Buffett's screening logic is public and simple: durable competitive advantage, consistent earnings, and a price that makes sense.
- Paid screeners earn their cost only if you have a defined process. Without one, they're expensive noise.
- Dividend growth screening requires just four filters: consecutive dividend increases, payout ratio, free cash flow yield, and sector diversification.
- The free Screener Recipe Builder on aistockpickerapps.com hands you ready-to-paste filter sets so you never start from scratch.
Drowning in Screener Filters? This Is the Only Setup You Need
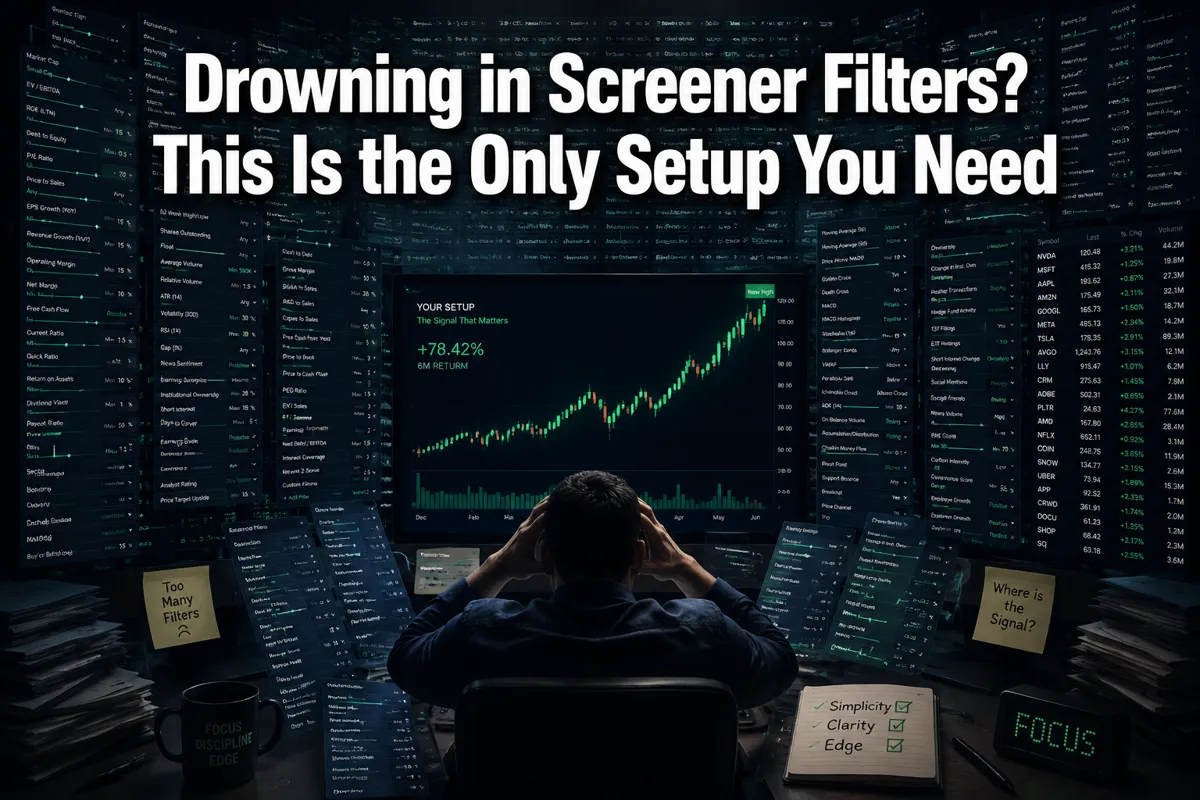
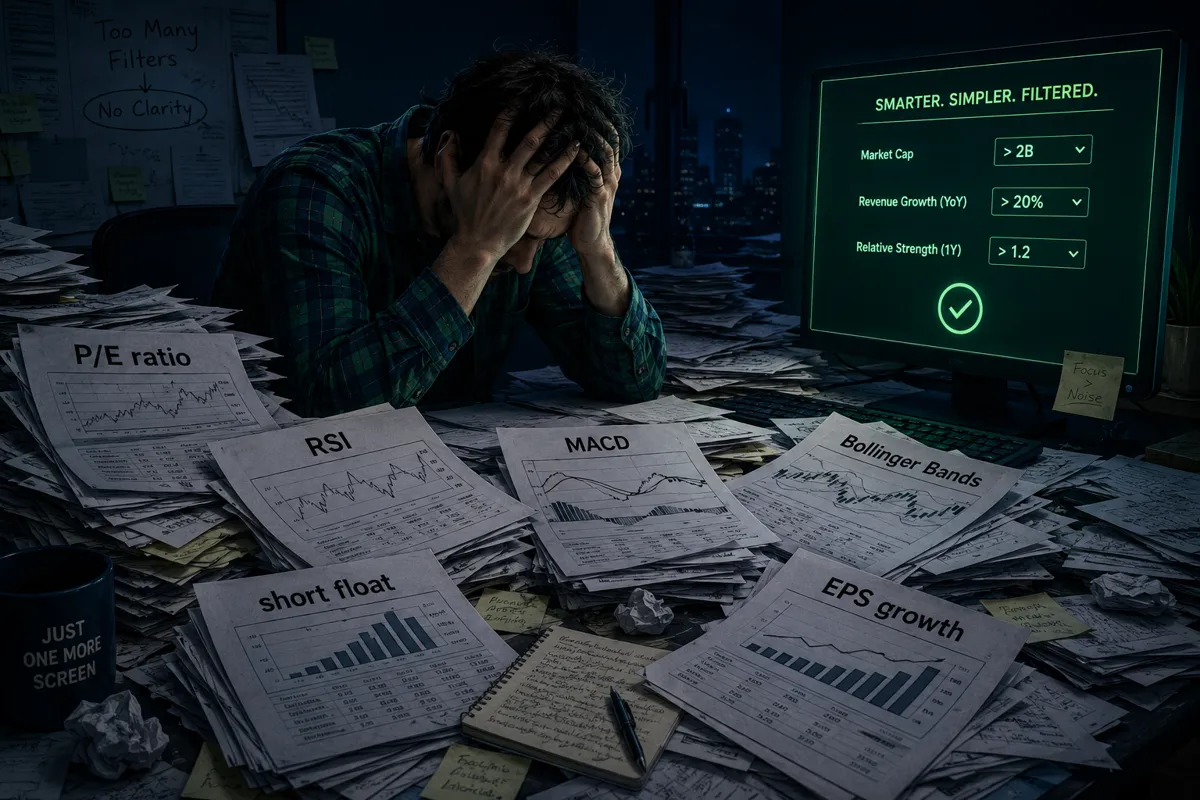
You've got 47 filters active. Volume, RSI, MACD, short float, EPS surprise, price-to-book, beta, Bollinger Band width, average true range, and seventeen more things you added after watching a YouTube video at 11 p.m. last Tuesday.
The result? Zero trades. Or worse — a trade you can't explain, on a stock you don't understand, that immediately goes against you.
This is filter overwhelm. It's the screener equivalent of standing in a grocery store for 45 minutes because you have too many options and leaving with a bag of chips. You came in for dinner. You left with regret.
If you're drowning in screener filters, this is the only setup you need: fewer inputs, a defined process, and a saved template you actually run consistently. The rest is noise.
What Are Stock Screener Filters and Why Do They Matter
Stock screener filters are criteria you set to narrow a universe of thousands of stocks down to a manageable shortlist that fits your strategy. They matter because without them, you're not investing — you're browsing.
Think of a screener as a hiring filter for your portfolio. You wouldn't interview every person who ever applied to a job. You'd set minimum qualifications first. Screeners do the same thing for stocks: they cut the universe from 8,000+ publicly traded names down to the 10 or 20 that actually deserve your attention today.
The problem isn't that filters exist. The problem is that most traders treat a screener like a slot machine — keep pulling levers until something pays out. That's not a process. That's gambling with extra steps.
What filters actually do:
- Remove stocks that don't fit your risk profile (too small, too volatile, too illiquid)
- Surface candidates that match a specific setup (breakout, value, momentum, dividend)
- Save time by automating the first pass so you can spend energy on the final decision
Every filter you add narrows the result set. Add too many and you get zero results, or you start tweaking filters to force results — which defeats the entire purpose.
The Only Screener Setup Most Traders Actually Need
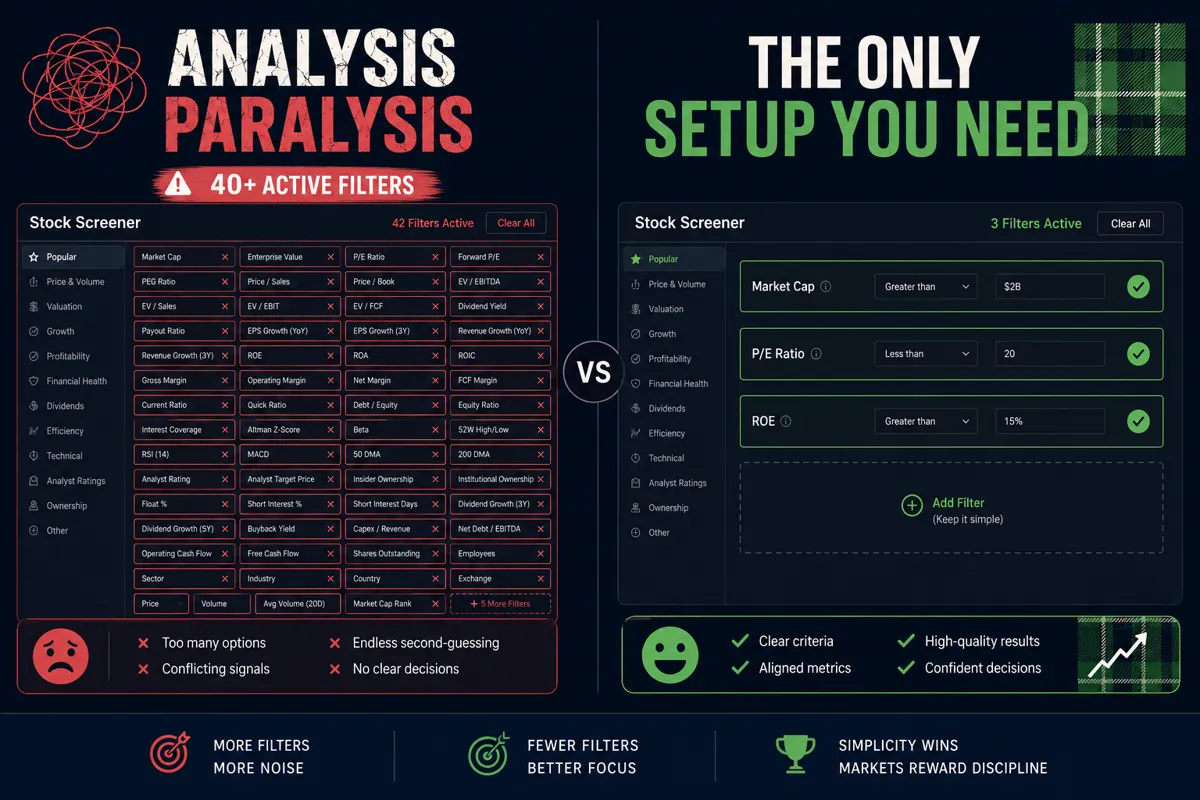
The answer to "Drowning in Screener Filters? This Is the Only Setup You Need" is embarrassingly simple: three filters, saved as a template, run on a schedule.
ScreenerHub's beginner framework recommends exactly this approach: start with market cap at or above $2 billion, P/E ratio between 5 and 25, and return on equity at 10% or higher. That's it. Save it as "Beginner — Quality Large Caps" and run it every Sunday night before the week opens.
For day traders, ChartMill's minimal intraday setup uses a gap filter (stocks up 2% or more pre-market), a minimum price filter for liquidity, and volume confirmation. Three inputs. Clean. Repeatable.
The core workflow:
- Screen — run your saved filter set against the full market
- Save — export the output to a watchlist, not a trade list
- Monitor — watch the candidates through the session or week
- Act — enter only when price action confirms the setup
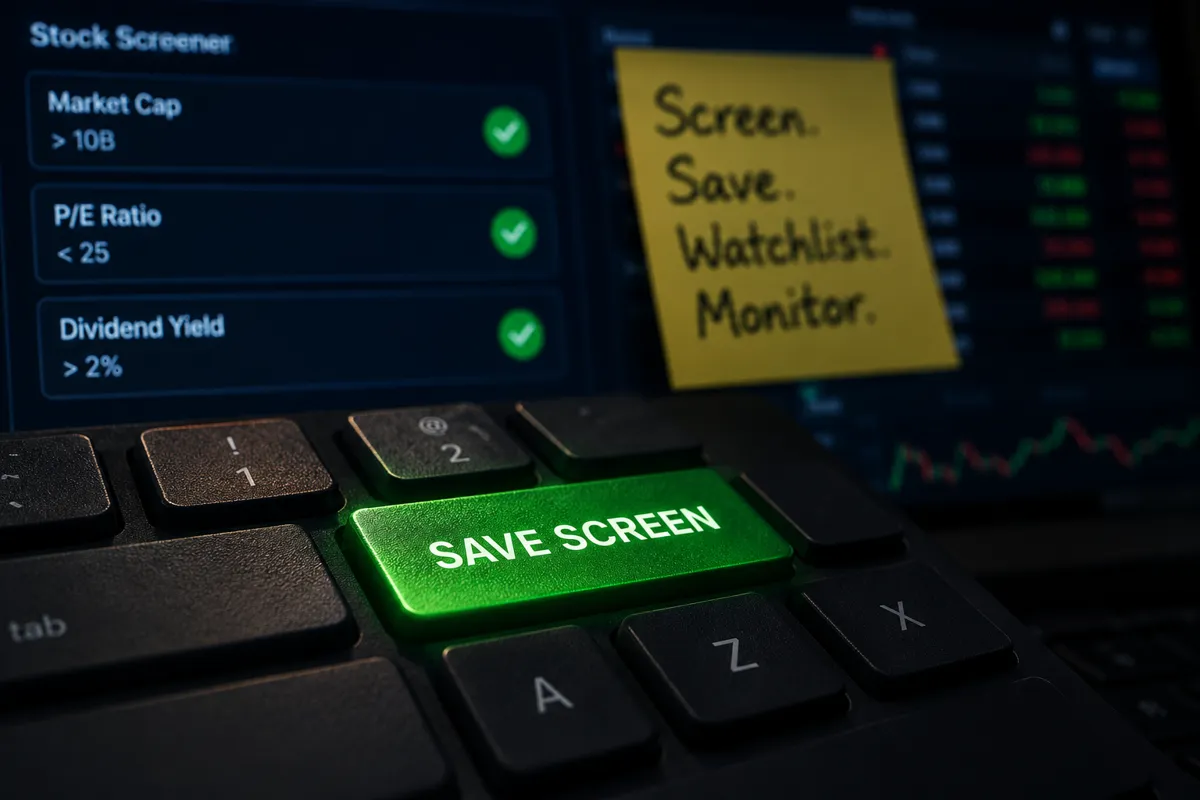
That loop — screen, save, watchlist, monitor — is the entire system. Everything else is decoration.
How Do Professional Investors Use Stock Screeners Effectively
Professional investors use screeners as a first pass, not a final answer. The screen surfaces candidates; the analyst does the work.
A fund manager running a value strategy doesn't stare at 40 filters. They define their universe (large-cap U.S. equities, for example), apply three to five fundamental filters, and then read the actual filings on whatever comes through. The screener does the sorting. The human does the thinking.
The key discipline professionals use that most retail traders skip: they don't change the filter set based on results. If the screen returns 12 names this week and 4 next week, that's fine. The process stays consistent.
What separates a pro screener setup from a beginner one:
- Saved templates with version control (they know what changed and when)
- A defined review cadence — not "whenever I feel like it"
- Separation between the screen output and the trade decision
- Position sizing rules that apply before any filter is even run
Process over prediction. Every time.
What Are the Most Important Metrics to Include in a Stock Screener
The most important metrics depend entirely on your strategy. There is no universal "best" filter set — but there are filters that do the most work per input.
For fundamental/value screening:
- Market cap (sets the size universe — avoid micro-caps until you know what you're doing)
- P/E ratio (price relative to earnings — a rough valuation anchor)
- Return on equity (how efficiently management uses shareholder capital)
- Debt-to-equity (balance sheet health — high debt amplifies every mistake)
For momentum/swing trading screening:
- Relative volume (today's volume vs. the 20-day average — signals unusual activity)
- Percentage change from prior close (momentum confirmation)
- Price above 50-day and 200-day moving averages (trend direction)
- Average true range (ATR) as a volatility filter for position sizing
For day trading specifically:
- Pre-market gap percentage (2% or more is the standard starting point)
- Current price above a minimum threshold (filters out illiquid penny stocks)
- Float size (low float stocks move faster — relevant for momentum day traders)
The rule: pick the three to five filters that directly answer "does this stock fit my strategy?" Anything beyond that is usually anxiety dressed up as due diligence.
Which Free Stock Screener Tools Are Best for Beginners
For beginners, Finviz is the standard starting point. It's free, fast, and lets you apply fundamental and technical filters without a login. You can replicate the three-filter beginner setup — market cap, P/E, ROE — in under two minutes.
TradingView is the next step up. The free tier allows basic screening with chart integration, so you can visually confirm a setup without switching tabs. For swing traders who need to see price action alongside the filter output, this matters.
Finviz and WallStreetZen both offer clean interfaces with enough filter depth to run a serious fundamental screen without paying anything.
Quick comparison for beginners:
| Tool | Free Tier | Best For | Standout Feature |
|---|---|---|---|
| Finviz | Yes | Fundamental + technical | Fast filter UI, heat maps |
| TradingView | Yes (limited) | Chart-integrated screening | Multi-timeframe charts |
| WallStreetZen | Yes | Fundamental analysis | Plain-English stock grades |
| Scanz | Trial only | Day trading | Real-time scanner speed |
Before spending money on any tool, use the free Screener Recipe Builder to get a ready-made filter set matched to your strategy. Paste it directly into Finviz. No guessing required.
How Much Does a Professional Stock Screening Tool Cost
Most professional-grade screeners run between $20 and $200 per month, depending on the feature set and data speed. Real-time scanning tools for day traders sit at the higher end; fundamental research platforms for swing traders and investors are typically mid-range.
Rough cost tiers in 2026:
- Free: Finviz basic, TradingView free tier, WallStreetZen
- $20–$50/month: Finviz Elite, TC2000 basic, Market Chameleon
- $50–$100/month: TradingView Pro/Pro+, Trade Ideas standard
- $100–$200/month: Trade Ideas premium (with AI), Scanz professional
The honest answer: a paid screener is only worth the cost if you have a defined process to run through it. Paying $150/month for a tool you use inconsistently is not an edge — it's an expensive hobby. Start free, build the habit, then upgrade when the free tool's limitations are the actual bottleneck.
What Common Mistakes Do New Investors Make With Stock Screeners
The biggest mistake is treating the screener output as a buy list. It isn't. It's a research list. There's a significant difference.
The second biggest mistake is adding filters after a bad trade. A stock you found through your screen dropped 8%? The instinct is to add a filter that would have excluded it. Do that five times and your screen returns nothing — or only the stocks that would have been perfect in hindsight, which is useless going forward.
The most common screener mistakes:
- Over-filtering: 20+ active filters that produce 0 to 3 results, forcing you to loosen criteria randomly
- No saved template: running a different filter set every session, making results incomparable
- Skipping price action: buying a fundamentally screened stock without checking if the chart supports the entry
- Ignoring liquidity: screening for small-cap momentum plays without a minimum volume filter, then getting stuck in a position you can't exit
- Revenge trading after a screen miss: chasing a stock that ran without you because it showed up on your scan — that's a bull trap waiting to happen
- Analysis paralysis: running five different screens and never pulling the trigger because the lists don't agree
Play stupid games, win stupid prizes. If your process changes every week based on what hurt you last, you don't have a process. You have a reaction pattern.
Are Stock Screeners Useful for Day Traders or Just Long-Term Investors
Stock screeners are arguably more critical for day traders than for long-term investors, because the time window is smaller and the cost of a bad entry is immediate.
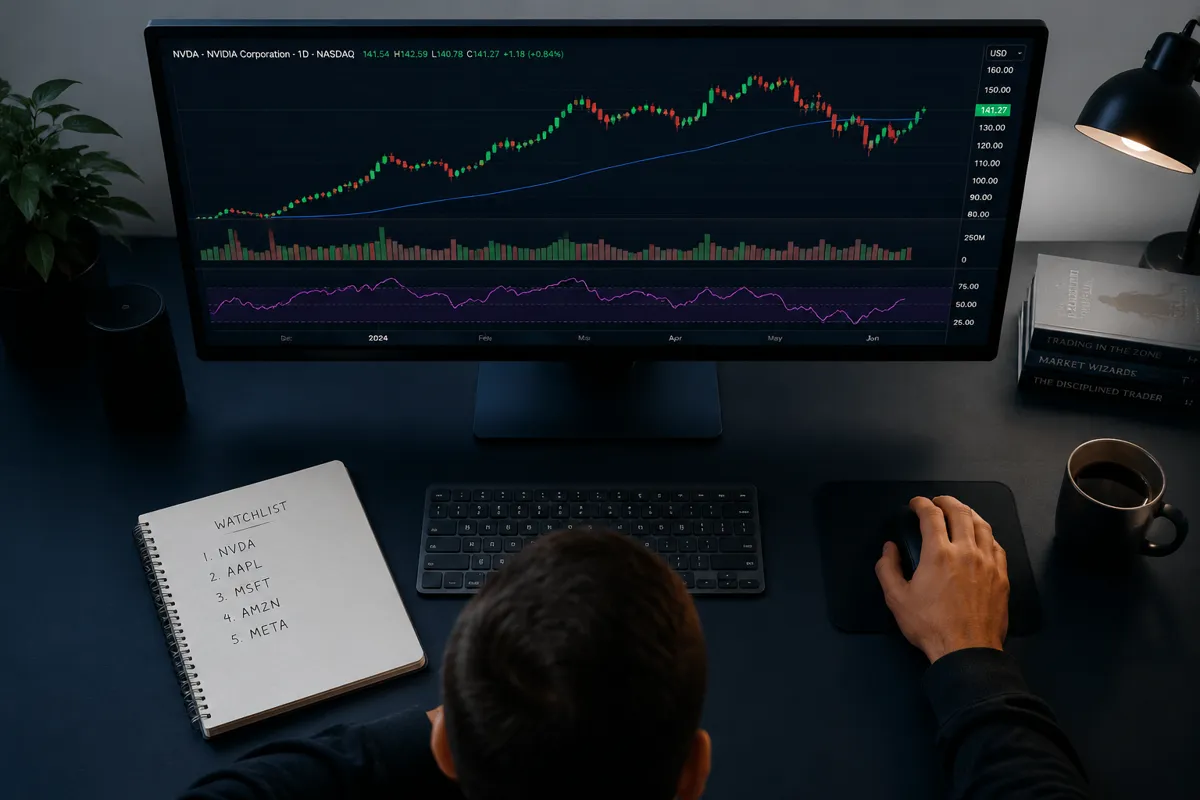
A long-term investor can afford to spend a week researching a stock after it clears a screen. A day trader has minutes. The screener has to do more of the heavy lifting, faster, with real-time data.
For day trading, the minimal setup that works is: pre-market gap of 2% or more, price above a minimum threshold (say, $5 to filter out illiquid names), and relative volume above 1.5x the 20-day average. That's the gap-and-volume setup that serious intraday traders actually run.
For swing traders, the screener runs overnight or on weekends. The goal is to build a watchlist of 5 to 10 names showing tight consolidation or basing near support, with a catalyst (earnings season, sector rotation, or a sector breakout) on the horizon.
For long-term investors, the screener runs monthly or quarterly. The goal isn't to find what's moving — it's to find what's cheap relative to quality.
Same tool, three completely different setups. The mistake is using a day trader's screener to find long-term investments, or vice versa.
Can Stock Screeners Help Find Undervalued Stocks
Yes, but only if "undervalued" is defined before the screen runs. A screener can't tell you what's cheap — it can only surface stocks that meet the criteria you've defined for cheapness.
The classic value screen uses P/E ratio below the sector average, price-to-book below 1.5, and positive free cash flow. That combination filters for stocks trading at a discount to their assets and earnings without being cash-burning disasters. Tools like Validea take this further by running screens based on published strategies from famous investors, including Benjamin Graham's net-net approach and Joel Greenblatt's Magic Formula.
The trap: a low P/E can mean undervalued, or it can mean the market knows something you don't. A screener surfaces the candidate. Research explains why it's cheap. Never skip that second step.
What Screening Filters Do Warren Buffett and Other Famous Investors Use
Warren Buffett's screening logic isn't secret. He's described it in shareholder letters for decades: durable competitive advantage (a moat), consistent earnings growth over 10 years, and a price that makes sense relative to intrinsic value. In screener terms, that translates to: ROE above 15% for 10 consecutive years, debt-to-equity below 0.5, and a P/E ratio below the stock's historical average.
Peter Lynch screened for PEG ratio (P/E divided by earnings growth rate) below 1.0 — stocks where growth was cheap relative to price.
Joel Greenblatt's Magic Formula screens for high earnings yield (the inverse of P/E) combined with high return on capital. Both metrics together find businesses that earn a lot relative to what you pay and what they invest.
Famous investor screen translations:
| Investor | Key Metric | Screener Filter |
|---|---|---|
| Warren Buffett | Durable moat + value | ROE >15%, D/E <0.5, consistent EPS growth |
| Peter Lynch | Growth at a reasonable price | PEG ratio <1.0 |
| Joel Greenblatt | Earnings yield + return on capital | Magic Formula rank (available on Finviz) |
| Benjamin Graham | Deep value | P/B <1.5, current ratio >2, positive earnings |
Validea automates all of these as named strategies. Worth checking before building your own version from scratch.
How Often Should You Update Your Stock Screening Criteria
Update your criteria quarterly at most — and only when you have a data-driven reason, not an emotional one.
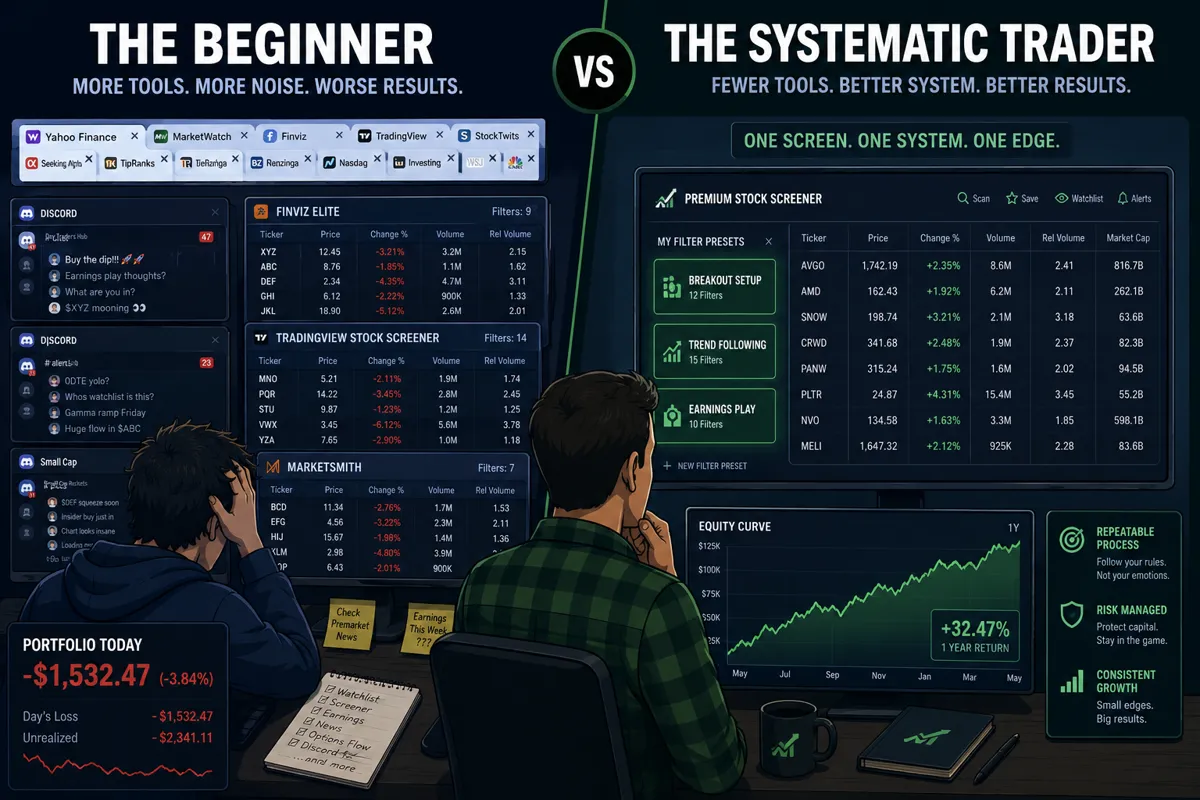
The screener is supposed to be a stable filter, not a mood ring. If you're changing it every week, you're not refining a system — you're chasing results. That's the definition of inconsistency, and inconsistency is what separates traders who compound slowly from traders who blow up repeatedly.
A reasonable update schedule:
- Daily: Run the saved screen, don't change it
- Weekly: Review the watchlist output, remove stocks that no longer qualify
- Monthly: Check if results are aligning with your strategy goals
- Quarterly: Evaluate whether the filter logic still fits market conditions (a momentum screen built for a trending market needs adjustment in a choppy tape)
- Annually: Full review of every filter — is each one earning its place?
The one exception: if market structure changes significantly (a regime shift from growth to value, for example), a mid-cycle adjustment is reasonable. But that's a strategic decision, not a reaction to last week's losers.
What Technical Indicators Work Best in Stock Screeners
The technical indicators that work best in screeners are the ones that answer a single question cleanly: is this stock in a position to move?
Relative volume answers: is there unusual interest right now? Moving average position (price above or below the 50-day and 200-day) answers: what's the trend? RSI answers: is the stock overextended or basing? ATR answers: how much does this stock typically move, so I can size my position correctly?
Technical filters ranked by usefulness in a screener:
- Relative volume (above 1.5x or 2x average) — the single most useful momentum filter
- Price vs. 50-day moving average — trend confirmation
- RSI between 40 and 70 — not overextended, not in freefall
- ATR as a position sizing input — not a filter, but a calculation to run post-screen
- Percentage from 52-week high — useful for breakout setups (within 5% of highs)
What doesn't work well in screeners: MACD crossovers, Bollinger Band squeezes, and most oscillators. These are chart-reading tools, not screening tools. They require visual confirmation to be useful. Run them on the chart after the screener surfaces a candidate — not as a filter that eliminates stocks before you've seen the chart.
Are Paid Stock Screeners Really Better Than Free Ones
Paid screeners are better in specific, measurable ways: real-time data, more filter options, backtesting, and alert systems. Whether those advantages matter depends entirely on your strategy.
For a long-term investor running a monthly fundamental screen, Finviz's free tier is genuinely sufficient. The data is end-of-day, which is fine when you're not trading intraday. For a day trader who needs real-time gap scanners and pre-market movers, free tools fall short — the data latency alone can cost more than the subscription.
When to pay for a screener:
- You're day trading and need real-time or pre-market data
- You want backtesting to validate a filter set before trading it live
- You need multi-timeframe scanning (e.g., daily trend + hourly entry)
- You want AI-assisted screening that adapts to market conditions
When the free version is enough:
- You're a swing trader or investor running end-of-day screens
- You're still learning — paper trade it first before paying for premium data
- Your edge is research quality, not screening speed
The Screener Recipe Builder generates ready-to-use filter sets that work on free tools. Start there. If the free tool's limitations become the actual constraint on your process, then upgrade.
How Do I Screen for Stocks With Consistent Dividend Growth
Screening for dividend growth requires four filters: consecutive years of dividend increases (10+ years is a common threshold), payout ratio below 60% (so the dividend is sustainable), positive free cash flow yield (confirming the dividend is backed by real cash), and a reasonable yield range (1% to 5% filters out both yield traps and low-yield growth stocks).
Dividend growth screener setup:
- Consecutive dividend increases: 10+ years (some screens use 5+ for a broader universe)
- Payout ratio: below 60% (below 40% is conservative and more sustainable)
- Free cash flow yield: positive (the company generates more cash than it pays out)
- Dividend yield: 1.5% to 4.5% (avoids yield traps above 6% and near-zero yielders)
- Optional: sector filter to avoid over-concentration in utilities or REITs
Finviz can run most of this. For deeper dividend analysis, tools like Simply Wall St visualize dividend sustainability in a way that's easier to interpret than raw numbers.
One warning: a 25-year dividend growth streak is impressive until the business model breaks. The screener finds the candidates. The research confirms whether the streak is likely to continue.
FAQ
What is the minimum number of filters I should use in a stock screener?
Three is the practical minimum for a useful screen: one to define the universe (market cap or exchange), one to filter for quality or momentum, and one to filter for value or activity. Fewer than three and you're not screening — you're browsing.
Can I use the same screener setup for both swing trading and day trading?
No. Day trading screens need real-time data and focus on gap, volume, and price. Swing trading screens run end-of-day and focus on trend, consolidation, and fundamentals. Using a day trader's screen for swing trades (or vice versa) produces irrelevant results.
How do I avoid analysis paralysis with stock screeners?
Set a rule: the screen runs once, you take the top 10 results, and you do not add or remove filters until your quarterly review. Discipline beats prediction. The paralysis comes from treating the screen as a negotiation rather than a process.
Is Finviz good enough for serious traders?
Finviz's free tier is good enough for fundamental screening and end-of-day technical filters. Finviz Elite adds real-time data and backtesting. For most retail swing traders and investors, the free tier is a legitimate starting point.
What does "relative volume" mean in a stock screener?
Relative volume compares today's trading volume to the stock's average volume over a set period (usually 20 days). A relative volume of 2.0 means the stock is trading at twice its normal pace — a signal that something unusual is happening, for better or worse.
Should I screen for stocks before or after market hours?
Both, depending on your strategy. Day traders screen pre-market for gap plays. Swing traders and investors screen after market close when the day's data is final. Running a screen during market hours on a free tool with delayed data is the worst of both worlds.
What is a "float" filter and when should I use it?
Float refers to the number of shares available for public trading. Low float stocks (under 20 million shares) move more violently on volume because supply is limited. Use a float filter if you're specifically trading momentum or gap plays. Avoid it if you're screening for stable, long-term holds.
How do I know if my screener setup is actually working?
Track every trade that came through the screen for 90 days. If the setup produces more winners than losers at a positive risk-reward ratio, it's working. If not, review the filter logic — not the individual trades.
Can AI improve stock screening?
Yes, in specific ways: AI can surface non-obvious correlations, process alternative data (sentiment, news flow, earnings call transcripts), and adapt filter weights based on market regime. Tools like Trade Ideas use AI to rank scan results by probability. That said, AI doesn't replace a defined process — it enhances one.
What's the difference between a screener and a scanner?
A screener runs on end-of-day data and is used for planning. A scanner runs in real-time and is used for intraday execution. Day traders need a scanner. Swing traders and investors need a screener. Many platforms offer both under the same subscription.
Conclusion: Stop Adding Filters. Start Running a System.
If you're still drowning in screener filters, the fix isn't a better tool. It's a simpler process.
Three filters. Saved as a template. Run on a schedule. That's the only setup you need to stop browsing and start building a repeatable edge.
Here's what to do right now:
- Go to the free Screener Recipe Builder and grab the filter set that matches your strategy — swing trading, value, momentum, or dividend growth.
- Paste it into Finviz (free) or TradingView and save it as a named screen.
- Run it at the same time every week. Don't change it for 30 days.
- Build a watchlist from the output. Trade only what confirms on the chart.
- Review results at 30 days. Adjust one filter at a time, with a reason.
Signal over noise. Systems over hacks. That's not a tagline — it's the only screener philosophy that actually compounds.
Browse the full breakdown of 100+ AI stock screening tools at aistockpickerapps.com, and find the one that fits the process you're actually building.
References
Stock Screening For Beginners - https://screenerhub.app/learn/stock-screening-for-beginners
244 Day Trading Stock Screener Settings - https://www.chartmill.com/documentation/stock-screener/technical-analysis-trading-strategies/244-Day-Trading-Stock-Screener-Settings
Guide For Screener - https://www.scribd.com/document/924035709/Guide-for-Screener
How To Build A Custom Stock Screener Setup - https://scanz.com/how-to-build-a-custom-stock-screener-setup/
This Is How I Screen For Stocks What About You - https://www.reddit.com/r/Daytrading/comments/18pqtph/this_is_how_i_screen_for_stocks_what_about_you/
Studyfilters - https://toslc.thinkorswim.com/center/howToTos/thinkManual/Scan/Stock-Hacker/studyfilters