How to Find a Trading Edge Before You Risk a Single Dollar
Last updated: July 19, 2026
Quick Answer
A trading edge is a repeatable, statistically validated advantage that gives you a higher probability of profit over many trades. You find one by identifying a specific setup or pattern, backtesting it against historical data to confirm positive expectancy, then paper trading it in real time to prove it works under current market conditions, all before you risk actual capital. Most traders skip this validation step and pay for it with their account balance.
Key Takeaways
- A trading edge is not a hot tip or a gut feeling, it's a tested system with positive expectancy (average win × win rate > average loss × loss rate).
- Backtest your strategy against at least 100 historical trades to establish statistical significance before trusting it with real money.
- Paper trading bridges the gap between backtest and live trading, exposing execution gaps, emotional friction, and real-time decision pressure without financial risk.
- Free tools like TradingView, QuantConnect, and broker simulators let you validate strategies without spending hundreds on software.
- Edge decay is real, strategies stop working as markets evolve, so continuous testing and adaptation are non-negotiable.
- Win rate alone means nothing; a 40% win rate with 3:1 risk-reward beats a 60% win rate with 1:1 every time.
- Professional traders use paper accounts to test new setups, refine entries, and debug systems, it's not just for beginners.
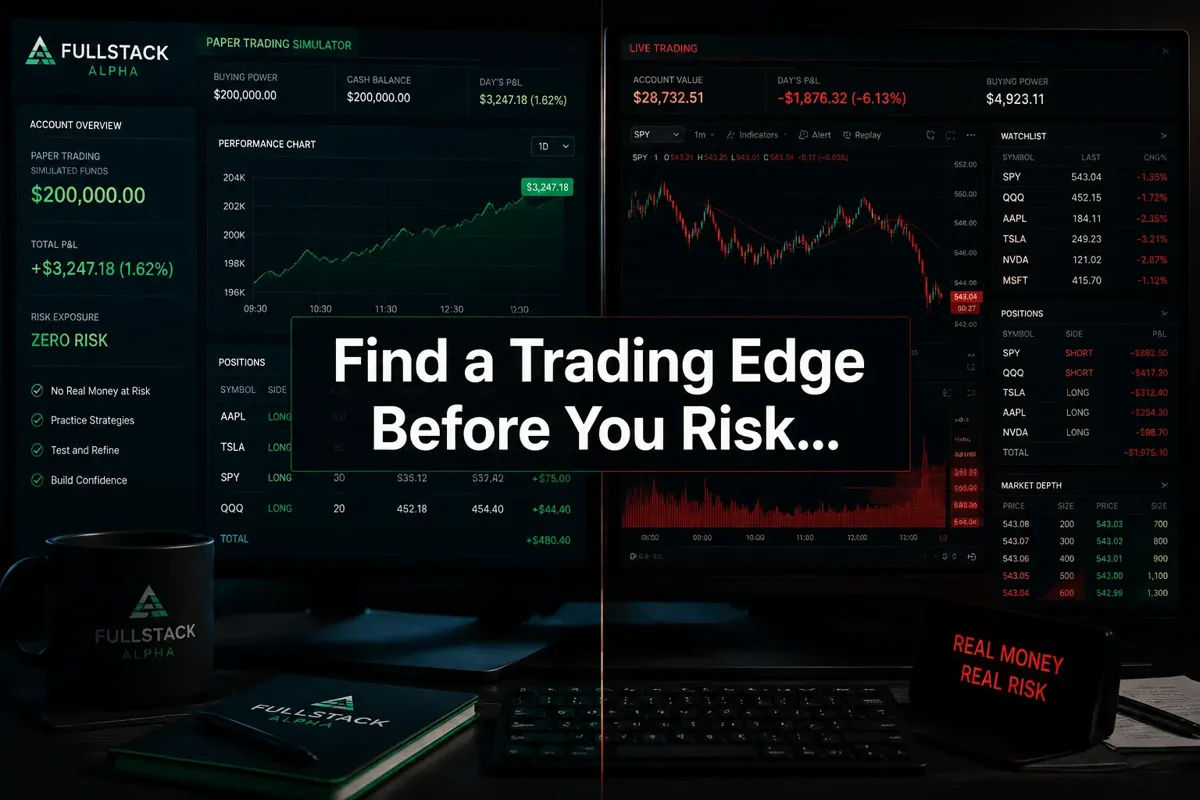
How to Find a Trading Edge Before You Risk a Single Dollar
Here's the truth most trading gurus won't tell you: the edge isn't in the indicator, the scanner, or the Discord channel. It's in the process you build before you ever click "buy."
A trading edge is a repeatable method that tilts probability in your favor over a statistically significant sample of trades. It's not about being right every time, it's about being right enough, with the right risk-reward ratio, that you come out ahead after 100 trades. And the only way to know if you have that is to test it without losing money first.
Most retail traders do the opposite. They find a setup that looks good, take a few trades, hit a winner, then assume they've cracked the code. They scale up. Then the setup fails three times in a row and they're down 15%. That's not trading, that's gambling with extra steps.
The process to find a real trading edge before you risk a dollar breaks into three stages: define the setup, backtest it for positive expectancy, and paper trade it in real time. Skip any of these and you're flying blind.
What Is a Trading Edge in the Stock Market?
A trading edge is a specific, repeatable condition or pattern that gives you a statistical advantage over random chance. It's the reason you make money, not luck, not hope, not because you "feel" the market.
In concrete terms, an edge is a setup where your expectancy is positive. Expectancy is the formula that matters:
Expectancy = (Win Rate × Average Win) - (Loss Rate × Average Loss)
If that number is positive, you have an edge. If it's negative or zero, you're either breaking even or losing money over time, no matter how many trades you take.
For example: you win 45% of the time, your average win is $300, and your average loss is $150. Your expectancy is (0.45 × $300) - (0.55 × $150) = $135 - $82.50 = $52.50 per trade. That's a real edge.
Compare that to a trader who wins 60% of the time but cuts winners at $100 and lets losers run to $200. Their expectancy is (0.60 × $100) - (0.40 × $200) = $60 - $80 = -$20 per trade. They're losing money with a 60% win rate because their risk management is broken.
An edge isn't about being right more often, it's about making more when you're right than you lose when you're wrong, consistently, over dozens of trades. And the only way to know if you have that is to test it first.
Trading Edge vs Trading Strategy: What's the Difference?
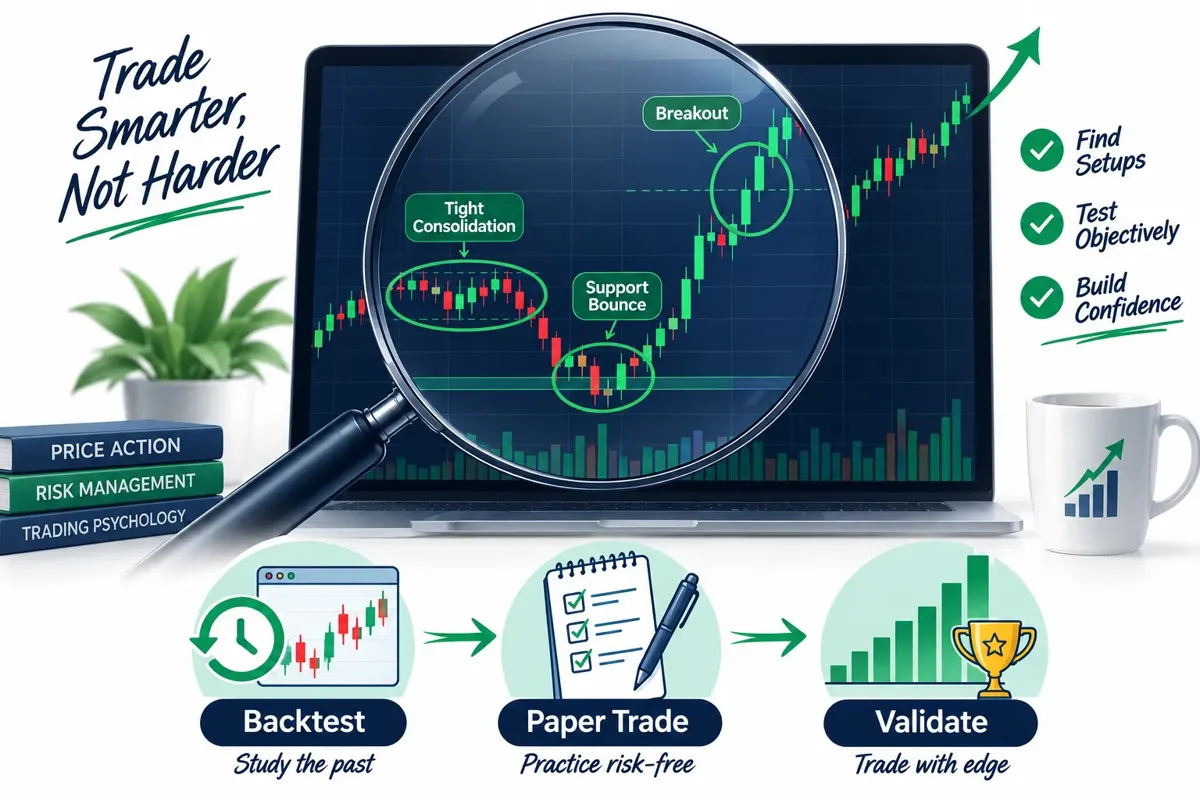
A strategy is the what, the specific rules you follow to enter and exit trades. An edge is the why, the statistical reason that strategy works.
Your strategy might be: "Buy stocks breaking above a tight consolidation on above-average volume, with a stop loss 2% below the breakout level and a target 6% above." That's a clear, repeatable process.
Your edge is the fact that, historically, stocks breaking out of tight consolidation with volume tend to continue moving in the direction of the breakout more often than they fail, and when they do continue, they move far enough to give you a 3:1 risk-reward ratio. That's the statistical advantage.
You can have a strategy without an edge. Plenty of traders follow rules that sound logical but don't actually produce positive expectancy when tested. That's why backtesting matters, it separates strategies that work from strategies that just sound good.
The edge is what you're hunting for. The strategy is how you capture it.
How to Backtest a Trading Strategy Without Losing Money
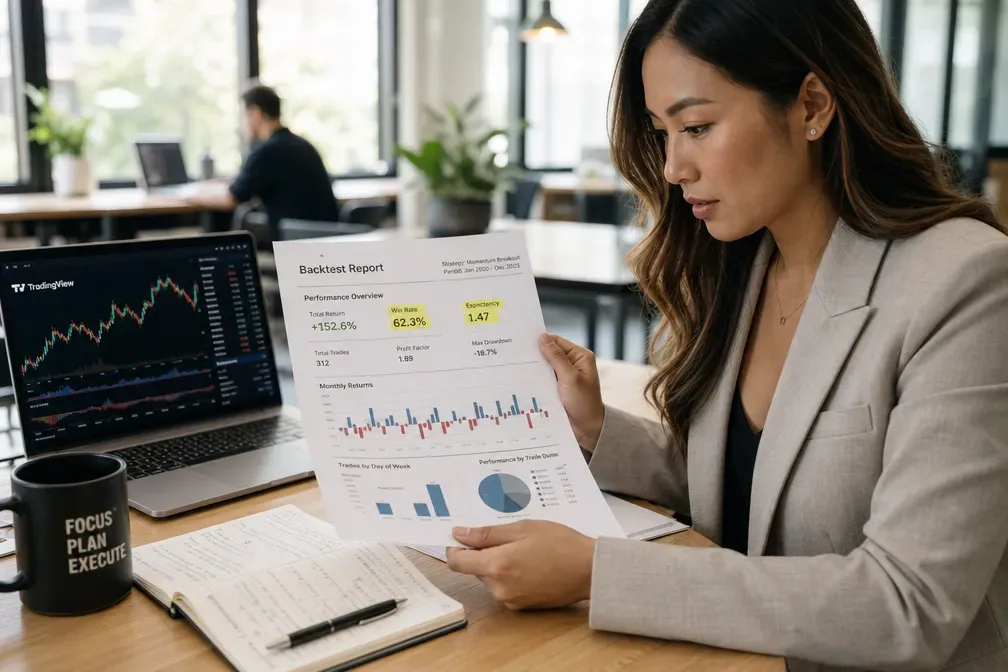
Backtesting is the process of running your strategy against historical price data to see how it would have performed in the past. It's not a guarantee of future results, but it's the closest thing you have to a time machine.
Here's how to do it without spending a dime:
Step 1: Define your setup with precision.
Write down the exact conditions that trigger a trade. "Buy the dip" is not a setup. "Buy when price pulls back to the 20-day moving average, holds above it for two consecutive days, and volume is below average during the pullback" is a setup.
The more specific you are, the easier it is to test. Vague rules produce vague results.
Step 2: Choose a backtesting tool.
Free options that work:
- TradingView, replay mode lets you scroll through historical charts bar by bar and manually test your setup. It's tedious but effective for visual learners.
- QuantConnect, open-source algorithmic backtesting platform. You'll need to code (Python or C#), but it's free and powerful.
- Composer, no-code backtesting for long-term strategies. Limited for day trading but solid for swing and position trades.
Paid tools like TrendSpider offer automated backtesting with more flexibility, but you don't need them to start.
Step 3: Run at least 100 trades.
Statistical significance matters. Ten trades tell you nothing. Fifty trades are better but still noisy. A hundred trades start to reveal whether your edge is real or random luck.
Track every trade: entry price, exit price, win or loss, size of win or loss, and the market condition (trending, choppy, volatile). This data is your proof.
Step 4: Calculate your expectancy.
Use the formula from earlier. If your expectancy is positive and your win rate is at least 35-40%, you might have something. If it's negative, the strategy doesn't work, at least not in the market conditions you tested.
Step 5: Stress-test across different market conditions.
A strategy that works in a bull market might collapse in a bear market or a choppy tape. Test your setup across at least two different market environments (trending up, trending down, sideways). If it only works in one, your edge is fragile.
Backtesting isn't perfect. It doesn't account for slippage, execution delays, or the emotional pressure of real money. But it's the first filter. If a strategy can't pass a backtest, it has no business in your live account.
For more on how to identify setups worth testing, see our guide on how to find stocks for swing trading before everyone else does.
Paper Trading vs Real Money: Which Is Better for Beginners?
Paper trading is better for beginners, and it's not close.
Paper trading is simulated trading with fake money and real market data. You place trades, track results, and experience the decision-making process without financial risk. Every major broker offers it: TD Ameritrade's thinkorswim, Interactive Brokers, Webull, TradeZero, all have paper trading modes built in.
The argument against paper trading is that it doesn't replicate the emotional pressure of real money. That's true. You won't feel the same fear when a trade goes against you, or the same greed when it runs in your favor. But that's exactly why beginners should start there.
If you can't follow your rules with fake money, you won't follow them with real money. Paper trading exposes the gaps in your process before they cost you anything.
Here's what paper trading teaches you:
- Execution mechanics, how to place orders, set stop losses, and manage position size without fumbling in the moment.
- Setup recognition, whether you can actually spot your edge in real time, not just in hindsight.
- Discipline, whether you stick to your plan or start improvising when the market moves.
What paper trading doesn't teach you:
- Emotional control under real risk, the fear of losing your own money changes everything.
- Slippage and execution quality, paper fills are instant and perfect; real fills aren't.
The solution isn't to skip paper trading. It's to use it as a bridge. Backtest first, paper trade second, then go live with the smallest position size you can stomach. That's the sequence that keeps you in the game long enough to learn.
How Long Should I Paper Trade Before Using Real Money?
At least 30 trades or 60 calendar days, whichever comes first, and only if your paper results show positive expectancy.
Thirty trades give you enough data to see if your edge holds up in real time. Sixty days expose you to different market conditions: trending days, choppy days, earnings season, low-volume summer tape, whatever the market throws at you.
If you hit 30 trades in two weeks because you're day trading, great, but still wait the full 60 days. You need to see how your strategy performs across time, not just across trade count.
Here's the checkpoint: after 30 trades and 60 days, calculate your expectancy. If it's positive and your win rate is at least 35%, you're ready to go live with small size. If it's negative or break-even, your edge isn't validated yet. Keep testing or revise the strategy.
Don't rush this. The market will still be there in two months. Your capital might not be if you skip the validation step.
Free Tools to Test Trading Strategies Before Investing
You don't need to spend $200 a month on software to validate a trading edge. Here are the free tools that actually work:
TradingView (free tier)
Replay mode lets you scroll through historical charts and manually test setups. It's slow, but it forces you to think through every trade. The free version limits you to one chart layout and fewer indicators, but that's enough to test a basic strategy.
QuantConnect
Open-source backtesting platform for algorithmic strategies. You write your strategy in Python or C#, and it runs against years of historical data. It's free, powerful, and used by professional quant traders. The learning curve is steep if you don't code, but the results are worth it.
Broker paper trading accounts
Every major broker offers a free paper trading account with real-time data:
- TD Ameritrade thinkorswim, full-featured platform, real-time data, unlimited paper money.
- Interactive Brokers, paper account mirrors the live platform exactly.
- Webull, simple interface, good for beginners, real-time paper trading.
- TradeZero, popular with day traders, offers paper accounts with real-time Level 2 data.
These are the same platforms you'll use live, so you're learning the execution mechanics at the same time.
TradingView + broker integration
If you use TradingView for charting, you can connect it to your broker's paper account and execute trades directly from the chart. It's the closest thing to live trading without the risk.
For a deeper dive into AI-powered tools that help you find setups faster, check out the AI stock trading software active traders quietly swear by.
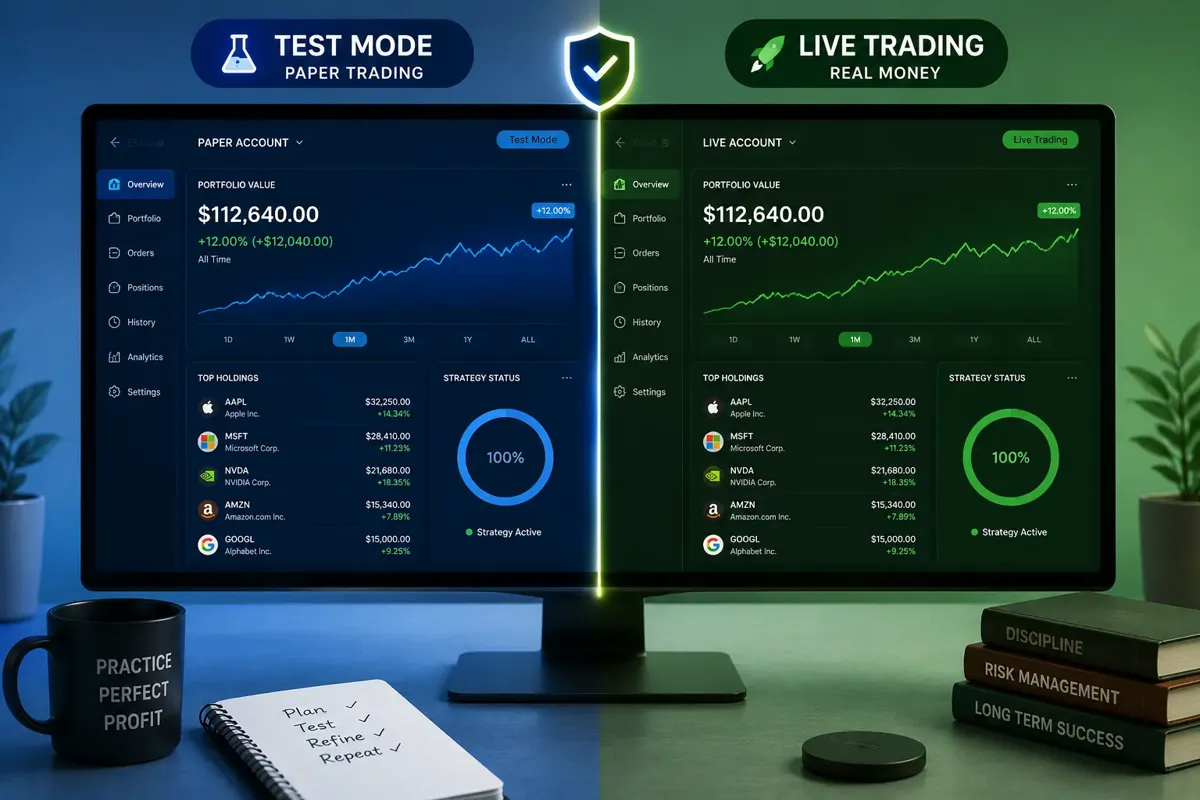
Do Professional Traders Use Paper Trading Accounts?
Yes. Not for the same reasons beginners do, but they use them.
Professional traders paper trade new strategies before risking firm capital. If you're testing a mean reversion strategy in a sector you've never traded, you don't just throw $50,000 at it on day one. You paper trade it for a month, track the results, and only go live if the edge holds up.
They also use paper accounts to debug execution issues. If you're testing a new order type, a new broker, or a new algo, you run it in simulation first to make sure it behaves the way you expect.
The difference is that pros already have a validated edge in their core strategy. They're using paper trading to expand or refine, not to learn from scratch. But the principle is the same: test before you risk.
If a trader managing millions uses paper accounts to validate new ideas, you should too.
How to Know If Your Trading Edge Actually Works
Your edge works if it produces positive expectancy over a statistically significant sample of trades, in multiple market conditions, and you can execute it consistently without breaking your rules.
Here's the checklist:
1. Positive expectancy over 100+ trades.
Run the formula. If your average win multiplied by your win rate is greater than your average loss multiplied by your loss rate, you have an edge. If not, you don't.
2. Works in at least two market environments.
Test it in a trending market and a choppy market. If it only works in one, your edge is conditional, and you need to know when to turn it off.
3. You can execute it without hesitation.
If you freeze up, second-guess entries, or skip trades because they "don't feel right," your edge doesn't matter. Execution is part of the edge.
4. It survives real-time pressure.
Backtests and paper trades are clean. Live trading is messy. If your edge falls apart the moment you risk real money, it's not an edge, it's a theory.
5. You can explain it in one sentence.
If you can't describe your edge clearly, "I buy breakouts above consolidation with 3:1 risk-reward", you probably don't have one. Complexity is not an edge. Clarity is.
The moment you can check all five boxes, you're ready to trade small and scale up as your confidence and results compound.
Statistical Significance in Trading: How Many Trades Are Needed?
At least 100 trades to start seeing signal over noise. Ideally 200+ to trust the data.
Here's why: trading outcomes are probabilistic, not deterministic. You can have a 60% win rate and still lose five trades in a row. That's not a broken strategy, that's variance.
With 10 trades, variance dominates. You could go 8-2 on pure luck or 2-8 on bad luck, and neither result tells you anything about your edge.
With 50 trades, you start to see patterns, but the sample is still noisy. A few big wins or big losses can skew the results.
With 100 trades, the law of large numbers starts to work in your favor. Your win rate, average win, and average loss stabilize. You can calculate expectancy with some confidence.
With 200+ trades, you have a robust data set. You can break it down by market condition, time of day, or setup variation and still have enough trades in each bucket to draw conclusions.
Professional traders track thousands of trades over years. But you don't need that to start. A hundred trades is the minimum threshold where your edge, if you have one, will reveal itself.
If you're not tracking every trade in a journal or spreadsheet, you're guessing. And guessing isn't an edge.
For tools that help you track and analyze your trades, explore the AI trading assistant that never sleeps and never panics.
Can You Find a Trading Edge with a Small Account Size?
Yes. Edge has nothing to do with account size. It's about probability and process, not capital.
A $1,000 account and a $100,000 account can trade the same edge. The difference is position size, not strategy. If your edge produces $50 per trade in expectancy, it doesn't matter if you're trading 10 shares or 1,000 shares, the percentage return is the same.
Small accounts do face practical constraints:
- Pattern day trader rule, if you have less than $25,000 in a U.S. margin account, you're limited to three day trades per five-day period. This forces you into swing trading or cash accounts.
- Commission drag, if you're paying $5 per trade and your average win is $50, commissions eat 10% of your edge. Use a zero-commission broker.
- Limited diversification, with $1,000, you can't spread risk across 10 positions. You're taking concentrated bets, which increases volatility.
But none of those constraints eliminate your edge. They just change how you execute it.
The best edges for small accounts:
- Swing trading, hold for days or weeks, avoid the PDT rule, and let the setup play out without micromanaging.
- Mean reversion on ETFs, lower volatility, predictable patterns, easier to backtest.
- High-probability breakouts, fewer trades, higher win rate, less capital required per position.
Small accounts force discipline. You can't overtrade, you can't revenge trade, and you can't afford to ignore risk management. That's not a disadvantage, it's training wheels for when your account grows.
If you're looking for scanners that help small accounts find high-probability setups, see 7 swing trade scanners that find setups before they break out.
Trading Simulators That Use Real Market Data
The best simulators mirror live market conditions as closely as possible. Here's what to look for:
Real-time data, not delayed.
A 15-minute delay makes the simulator useless for day trading. You need to see price action as it happens.
Realistic order fills.
Some simulators give you perfect fills at the bid or ask every time. Real markets don't work that way. Look for simulators that model slippage and partial fills.
Full order types.
If you can't practice stop-limit orders, trailing stops, or bracket orders, you're not learning the execution mechanics you'll need live.
Top simulators:
- TD Ameritrade thinkorswim, real-time data, full order types, mirrors the live platform exactly. Free with a paper account.
- Interactive Brokers Paper Trading, same platform as live, real-time data, used by professional traders.
- TradeZero Free Trial, real-time Level 2 data, popular with day traders, realistic fills.
- Webull Paper Trading, simple interface, real-time data, good for beginners.
- TradingView Paper Trading, integrates with your charts, real-time data, clean execution.
The goal isn't to find the fanciest simulator. It's to find one that matches the platform you'll use live, so you're not relearning the interface when you switch to real money.
Why Do Trading Edges Stop Working Over Time?
Because markets adapt. What worked last year might not work this year. What worked in a bull market might fail in a bear market. Edge decay is real, and ignoring it is how profitable traders go broke.
Here's why edges decay:
1. Market structure changes.
High-frequency trading, algorithmic execution, and retail order flow have changed how stocks move. Patterns that worked in 2010 don't work the same way in 2026.
2. Crowding.
When a strategy becomes popular, it stops working. If everyone is buying the same breakout setup, the setup gets front-run and the edge disappears.
3. Regime shifts.
A mean reversion strategy that works in a low-volatility environment might get crushed in a high-volatility environment. Your edge is conditional on the market regime, and regimes change.
4. Survivorship bias.
You backtest a strategy on stocks that are still trading today, but you don't account for the stocks that got delisted or went bankrupt. That skews your results and makes the edge look stronger than it is.
How to combat edge decay:
- Test continuously. Run your strategy against recent data every quarter. If the expectancy drops, adjust or retire the strategy.
- Diversify your edges. Don't rely on one setup. Have a mean reversion edge, a breakout edge, and a momentum edge. When one stops working, the others keep you in the game.
- Adapt to market conditions. Know when your edge works and when it doesn't. If you trade breakouts and the market goes choppy, step aside.
The traders who survive long-term aren't the ones who found one great edge in 2015 and rode it forever. They're the ones who validate, adapt, and retire strategies as the market evolves.
For more on how AI tools help you adapt faster, check out the AI stock apps traders are downloading before the next rally.
Is Technical Analysis Enough to Create a Trading Edge?
Technical analysis is a tool, not an edge. The edge comes from how you use it.
Price action, support and resistance, volume, and momentum are all valid inputs. But so is every other trader's chart. If you're looking at the same moving averages and RSI levels as everyone else, you don't have an edge, you have a crowded trade.
The edge comes from:
- Combining technical signals with context, a breakout in a strong sector with institutional buying is different from a breakout in a weak sector with no volume.
- Risk management, cutting losers fast and letting winners run turns a mediocre setup into a profitable edge.
- Execution discipline, taking every valid setup, not just the ones that "feel" good.
Technical analysis gives you the setup. Your process gives you the edge.
Plenty of traders use the same indicators and get opposite results. The difference isn't the indicator, it's the system around it.
Common Mistakes When Backtesting Trading Systems
1. Overfitting the data.
You tweak your strategy until it produces perfect results on historical data, but it falls apart live because you've optimized for noise, not signal. If your strategy has 15 rules and works only on one stock in one time period, you've overfit.
2. Ignoring transaction costs.
Backtests assume perfect fills with no slippage and no commissions. Real trading doesn't work that way. If your edge produces $30 per trade and slippage costs you $20, your edge just disappeared.
3. Using too small a sample.
Testing 20 trades and calling it validated is like flipping a coin five times and declaring it rigged. You need at least 100 trades to see if the edge is real.
4. Cherry-picking time periods.
Testing a strategy only during a bull market and assuming it works in all conditions is a recipe for disaster. Test across multiple market environments.
5. Not accounting for survivorship bias.
If you backtest only stocks that are still trading today, you're ignoring all the stocks that failed. That skews your results and makes the strategy look better than it is.
6. Skipping the paper trade step.
A backtest tells you what would have happened. A paper trade tells you what does happen when you execute in real time. The gap between the two is where most edges break.
The fix for all of these: test rigorously, track every trade, and validate in real time before you risk capital.
Frequently Asked Questions
What is the fastest way to validate a trading edge?
Backtest it against at least 100 historical trades, then paper trade it for 30 trades or 60 days in real time. If both show positive expectancy, you're validated. There's no shortcut that doesn't involve risk.
Can I use AI to find a trading edge?
AI can help you scan for setups, backtest faster, and identify patterns you might miss manually. But AI doesn't give you an edge, it gives you data. You still need to validate, execute, and manage risk. Tools like TrendSpider and Trade Ideas can speed up the process, but they're not magic.
How do I know if my win rate is high enough?
Win rate alone doesn't matter. A 40% win rate with 3:1 risk-reward produces better results than a 60% win rate with 1:1. Focus on expectancy, not win rate.
What's the difference between a trading edge and luck?
Luck is random. An edge is repeatable. If you can't explain why your strategy works, and you can't reproduce the results over 100 trades, it's luck.
Do I need to backtest every single setup I trade?
Yes. If you're risking real money on a setup, you should know its historical performance. Skipping this step is how traders blow up.
How much money do I need to start testing a trading edge?
Zero. Use paper trading and free backtesting tools. You don't need capital to validate an edge, you need time and discipline.
Can a trading edge work in all market conditions?
No. Most edges are conditional. A breakout edge works in trending markets but fails in choppy markets. A mean reversion edge works in range-bound markets but gets crushed in strong trends. Know when your edge works and when to step aside.
What's the best trading edge for beginners?
Swing trading breakouts with tight consolidation and above-average volume. It's visual, easy to backtest, and doesn't require fast execution. Pair it with strict risk management and you have a solid starting edge.
How often should I re-test my trading edge?
Every quarter. Markets change, and edges decay. Run your strategy against recent data every three months to make sure it still works.
What's the biggest mistake traders make when looking for an edge?
They skip the validation step. They find a setup that looks good, take a few trades, hit a winner, and assume they've found an edge. Then they scale up and the setup fails. Test first, trade second.
Can I trade multiple edges at the same time?
Yes, and you should. Diversifying your edges reduces risk and keeps you in the game when one strategy stops working. Just make sure each edge is validated independently.
What's the minimum sample size to trust a backtest?
At least 100 trades. Anything less is too noisy to draw conclusions.
Conclusion
Most traders lose money because they skip the step that matters most: validation. They find a setup, take a few trades, and assume they've found an edge. Then the market humbles them.
A real trading edge is a repeatable, statistically validated advantage that produces positive expectancy over dozens of trades. You find it by defining a specific setup, backtesting it against historical data, and paper trading it in real time, all before you risk a single dollar.
The process isn't glamorous. It's slow, methodical, and boring. But it's the only process that works. Backtest until you have 100 trades. Paper trade until you can execute without hesitation. Then go live with small size and scale up as your results compound.
The market rewards patience and punishes shortcuts. If you're not willing to test your edge before you trade it, you're not trading, you're gambling.
Want the tools and systems that help you validate an edge faster, without the hype? Start at aistockpickerapp.com.