ETF Screener: How to Spot a Fund Paying You Your Own Money
Last updated: August 30, 2026
Quick Answer: Some ETF distributions are not income at all. They are your own invested principal handed back to you, repackaged as a payout. An ETF screener sorted by yield will surface these funds at the top of the list, and most income-focused investors never look past that number. This guide shows you exactly how to tell the difference, in about five minutes, using free tools and the fund's own disclosures.
Key Takeaways
- A dividend ETF screener sorted by highest yield will rank funds that return capital ahead of funds that generate real income, because the yield calculation does not distinguish between the two.
- Return of capital (ROC) is a legal, disclosed practice. The disclosure lives in a document called a 19a-1 notice, published by the fund issuer, often before the distribution is paid.
- YieldMax's SLTY ETF reported a distribution that was 95.19% estimated ROC and only 4.81% income in August 2026. That is not a yield. That is a refund.
- YMAX, the YieldMax Universe Option Income ETF, showed a distribution of $0.0727 per share in early 2026 with 53% ROC, dropping to 25% ROC by mid-August 2026.
- SCHD, the Schwab U.S. Dividend Equity ETF, carries an expense ratio of 0.06% and distributes income sourced from actual dividends paid by its holdings, making it a structurally different product from options-income ETFs.
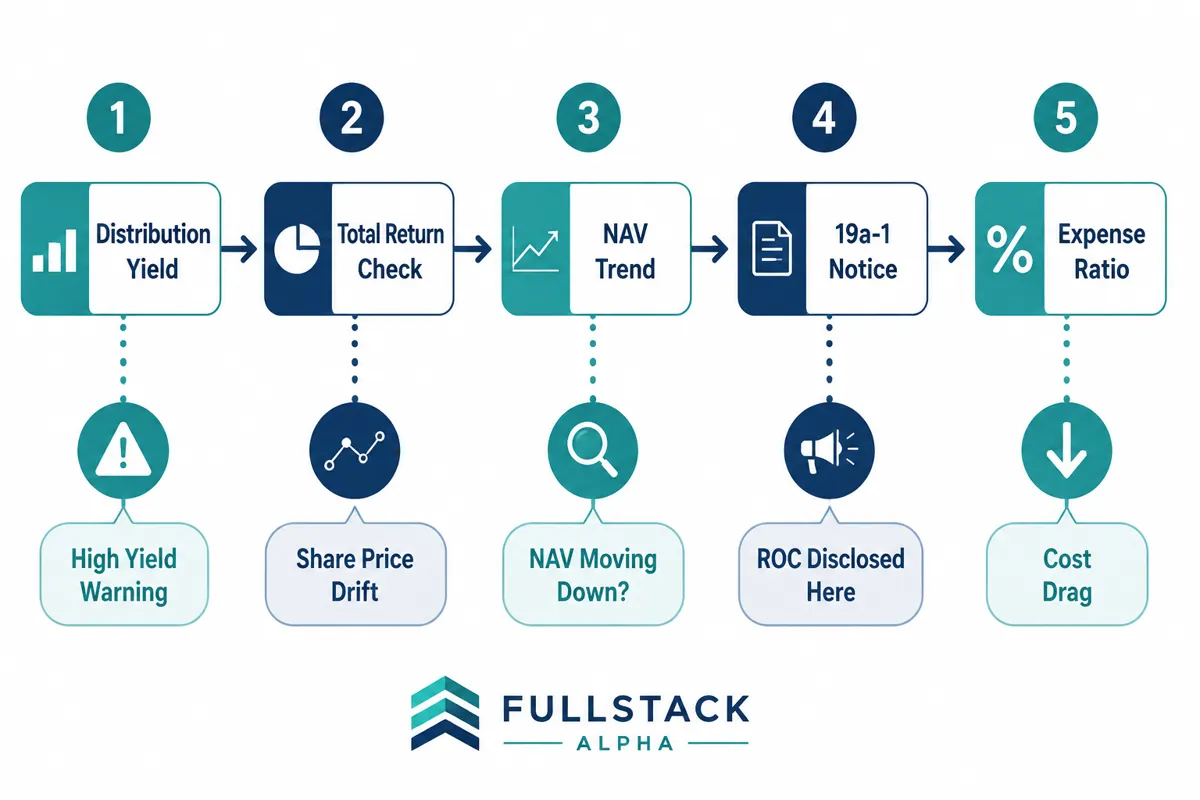
- Five checks catch most ROC-heavy funds: distribution yield vs. total return, the 19a-1 notice, NAV trend over three-plus years, income coverage ratio, and expense ratio relative to what the fund actually delivers.
- No ETF screener currently surfaces ROC percentage as a sortable column. You have to pull it from the fund's own disclosures or from ETF.com and Morningstar.
What Is an ETF Screener and How Does It Work?
An ETF screener is a filtering tool that lets investors sort and narrow a universe of exchange-traded funds by specific metrics: yield, expense ratio, asset class, index tracked, assets under management, and more. Type a threshold into a field, hit filter, and the tool returns every ETF that clears that bar. Most major platforms offer one for free, including Fidelity, Schwab, Morningstar, Yahoo Finance, and ETF.com.
The problem is not the tool. The problem is the metric most income investors sort by first: distribution yield. That single column does not tell you whether the distribution came from dividends, interest, capital gains, or the return of your own money. It just tells you the size of the payout relative to the share price. Sorting highest to lowest on yield and buying the top result is the financial equivalent of judging a restaurant by the size of the portion before tasting it.
A proper ETF screener for income investing is a starting point, not a verdict. The five-step detection method in this guide is what you run after the screener gives you a list.
How Do I Find ETFs with High Dividend Yields?
Finding high-yield ETFs takes about thirty seconds on any free ETF screener. Open ETF.com's ETF screener, select the income or dividend category, sort by distribution yield descending, and you have a ranked list. The same filter exists on the Vanguard ETF screener, the Fidelity ETF screener, and the Schwab ETF screener. The Morningstar ETF screener adds analyst ratings alongside the yield data, which is useful context.
The Yahoo Finance ETF screener lets you filter by category and sort by yield without an account. For a completely free ETF screener with no login required, ETF.com and Yahoo Finance are the two most practical starting points for U.S. investors.
What none of these tools show by default is the source of the distribution. A fund paying 20% annualized might be generating that from options premiums, from selling assets, or from returning your own principal. The yield column is the same number in all three cases. That is the gap this guide fills.
Quick reference: where to find each tool
- Free ETF screener, no login: ETF.com ETF finder, Yahoo Finance ETF screener
- Analyst-rated ETF screener: Morningstar ETF screener
- Broker-integrated ETF screener: Fidelity, Schwab, Vanguard
- ETF selection with full distribution history: ETF.com, Morningstar
What Does Return of Capital Mean in ETFs?
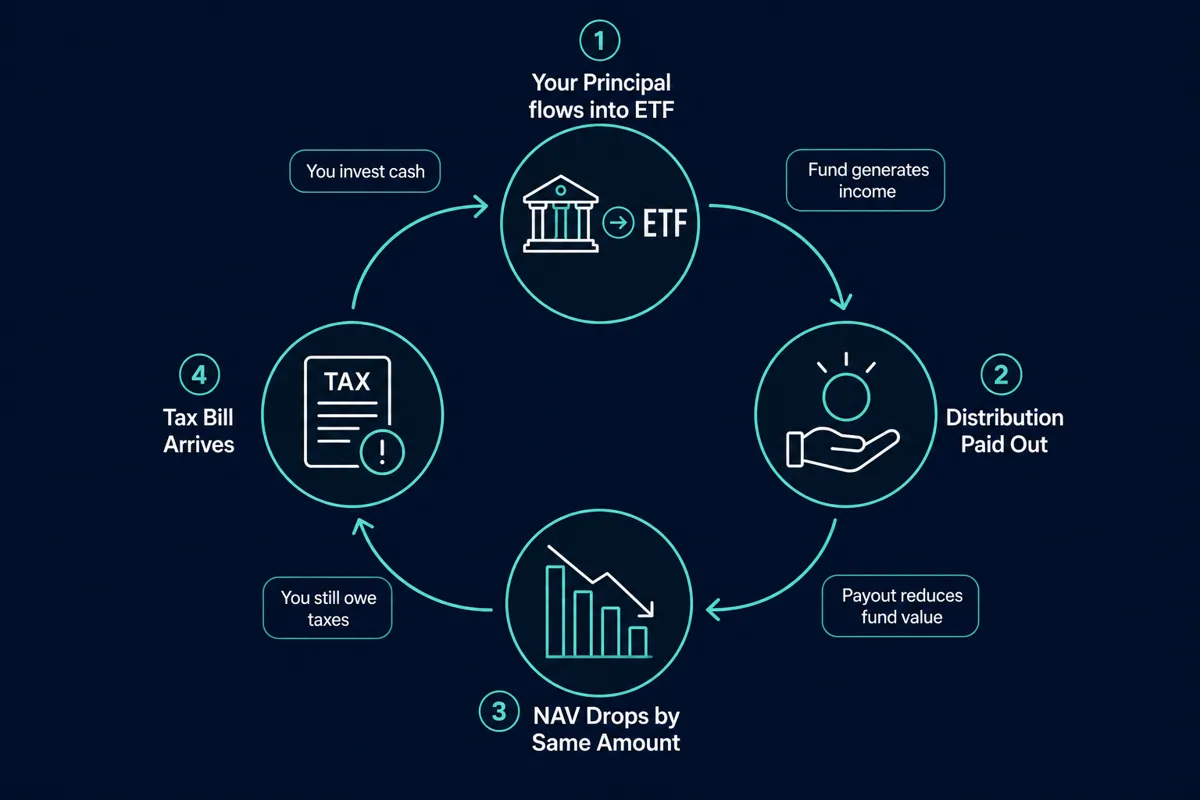
Return of capital means the fund paid you back some of your own money and called it a distribution. It is not income. It is not profit. It is the fund writing you a check from your own account. Your cost basis in the fund drops by the ROC amount, which means a larger taxable gain when you eventually sell, and your net worth does not actually increase from the payment.
The mechanics work like this: a fund collects premiums from selling options, or it sells holdings to raise cash, and it distributes that cash to shareholders. If the cash distributed exceeds the actual income and realized gains the fund earned, the excess is classified as return of capital. The SEC requires funds to disclose this when they believe a distribution may include ROC, using a document called a 19a-1 notice.
Return of capital is legal. It is disclosed. The problem is that the disclosure is buried in a PDF most investors never open, while the yield number is plastered across every screener and fund comparison page on the internet.
A fund can pay a large distribution while its share price declines by a similar amount, leaving the holder no better off before tax. That is not a yield. That is a withdrawal from your own account with extra paperwork.
How to Tell If an ETF Is Paying You Your Own Money: The Five-Step Check
This is the repeatable process. Run it in order on any fund that shows up at the top of a high dividend ETF screener. It takes about five minutes per fund.
Step 1: Compare Distribution Yield to Total Return
Pull up the fund on ETF.com or Morningstar. Look at the trailing one-year and three-year total return figures alongside the distribution yield. If the distribution yield is significantly higher than the total return over the same period, the fund is paying out more than it is earning. The gap is almost certainly being filled by return of capital or by eroding the fund's asset base.
A fund with a 20% distribution yield and a 2% total return over three years is not generating 20% income. It is generating roughly 2% and returning 18% of your principal to you in installments.
Step 2: Read the 19a-1 Notice
A 19a-1 notice (named after SEC Rule 19a-1) is a document fund managers must send to shareholders when a distribution may include something other than net investment income, such as return of capital or realized capital gains. For ETFs, issuers typically publish these notices on their own websites before or around the payment date.
For YieldMax ETFs, the 19a-1 notices are published directly on the fund pages and in a dedicated tax documents section. For other fund families, check the issuer's website under "tax information," "distributions," or "investor resources." Eaton Vance publishes 19a-1 notices for its closed-end funds in a similar format.
The notice will state, in percentage terms, how much of each distribution came from net investment income, realized capital gains, and return of capital. That is the number that matters.
Step 3: Check the NAV Trend Over Multiple Years
Net asset value (NAV) is the per-share value of the fund's underlying holdings. If a fund is genuinely generating income from dividends, interest, or options premiums that exceed its distributions, the NAV should hold roughly steady or grow over time. If the NAV is declining steadily year over year, the fund is paying distributions by liquidating assets, which is return of capital by another name.
Pull up a three-to-five year NAV chart on ETF.com or Morningstar. A declining NAV trend alongside a high yield is the clearest single signal that distributions are not sustainable.
Step 4: Check Income Coverage
Some fund pages and third-party tools like Morningstar will show net investment income per share alongside the distribution per share. If the distribution per share consistently exceeds the net investment income per share, the fund is paying out more than it earns from income. The shortfall is covered by selling assets or returning capital.
ETF.com and VettaFi both provide distribution history data that lets you track whether payouts have been growing, shrinking, or erratic. Erratic distributions are a signal worth investigating further.
Step 5: Check the Expense Ratio Against What the Fund Delivers
A high expense ratio is not automatically a problem, but it needs to be justified by what the fund provides. An options-income ETF charging 0.99% per year needs to generate enough options premium to cover that cost, pay distributions, and preserve NAV. If the NAV is declining and the expense ratio is high, the investor is paying for the privilege of getting their own money back.
Compare the expense ratio to peer funds in the same category using any free ETF screener. A plain equity income ETF like SCHD charges 0.06% per year. Options-income ETFs typically charge 0.49% to 0.99% or more. That cost difference needs to show up somewhere in the total return, not just in the yield figure.
Can You Lose Money with High Yield ETF Distributions?
Yes, and the mechanism is straightforward. If a fund pays out more than it earns, the share price falls by roughly the distribution amount on the ex-dividend date, and continues to fall over time as the asset base erodes. The investor receives cash in one hand while the value of their holding shrinks in the other. Before tax, the net effect is close to zero. After tax, it is negative, because return of capital distributions eventually create a larger taxable gain at sale.
The YieldMax family of options-income ETFs makes this visible in real time because the issuer publishes 19a-1 notices with specific ROC percentages before each payment date. In August 2026, SLTY (the Ultra Short Option Income Strategy ETF) reported a distribution that was 95.19% estimated return of capital and only 4.81% net investment income. YMAX (the Universe Option Income ETF) reported 48.95% ROC and 51.05% income for the same period. YMAG (the Aggregate Option Income ETF) reported 35.73% ROC and 64.27% income.
Looking at YMAX's distribution history across early 2026, the ROC component shifted materially: the January 1 distribution of $0.0727 per share carried 53% ROC, the January 8 distribution of $0.0709 carried 25% ROC, and the January 15 distribution of $0.0726 carried 27% ROC. None of this is hidden. All of it is disclosed. Most investors buying on yield alone never check.
TEST (the TSLA Performance and Distribution Target ETF) reported a distribution on August 17, 2026 that was 88.70% return of capital and 11.30% income. YQQQ (the Nasdaq-linked option income ETF) showed an August 26 distribution with 89.45% ROC and 10.55% income.
This is not an accusation of wrongdoing. YieldMax publishes these numbers prominently. The point is that a yield-sorted ETF screener will not show you any of this. You have to go find it.
What Is the Difference Between Dividend Yield and Distribution Yield?
Dividend yield and distribution yield are related but not identical, and the difference matters for income investors. Dividend yield specifically refers to income paid from dividends on the underlying holdings. Distribution yield is broader: it includes dividends, interest income, realized capital gains, and return of capital, all lumped into one annualized percentage.
A fund holding dividend-paying stocks like the Vanguard High Dividend Yield ETF (VYM) or SCHD pays distributions that are almost entirely sourced from the dividends its holdings pay. The distribution yield and the dividend yield are nearly the same number.
An options-income ETF pays distributions sourced from options premiums, which may or may not exceed the fund's costs and NAV erosion. The distribution yield can be very high. The dividend yield, in the strict sense, may be close to zero. A dividend ETF screener that filters by "dividend yield" may exclude options-income ETFs entirely, which is actually useful information.
When using any ETF screener, check which definition the platform is using. ETF.com distinguishes between "distribution yield" (trailing 12-month distributions divided by NAV) and "SEC yield" (a standardized 30-day yield based on net investment income). The SEC yield is a better proxy for sustainable income. If the distribution yield is much higher than the SEC yield, the gap is almost certainly return of capital or capital gains distributions.
What the Distribution Is Actually Made Of
The table below breaks down the five components that can appear in an ETF distribution, where each is disclosed, and what it signals about whether the payout is sustainable.
How to Avoid ETFs with Unsustainable Payouts
The short answer: check the source of the distribution before you buy, not after you see the first payout. Unsustainable payouts are not always obvious from a yield number, but they leave tracks everywhere else.
Three patterns that show up consistently in funds with unsustainable payouts:
1. High yield, low or negative total return. If the fund is paying 15% annualized but the total return over three years is 1%, the math does not work. The distributions are coming from somewhere other than earnings.
2. Declining NAV over multiple years. This is the clearest structural signal. A fund that consistently pays out more than it earns will show a staircase-down NAV chart. Pull it on Morningstar or ETF.com and look at the three-to-five year price history adjusted for distributions versus the NAV history without distributions. The gap tells the story.
3. High ROC percentage in the 19a-1 notice. When more than 50% of a distribution is return of capital, the fund is structurally paying you back your own money. That is not income. It is a slow liquidation. The YieldMax distribution schedule publishes 19a-1 data for every fund in the family before each payment date, which makes it one of the more transparent issuers in the options-income space. Use that transparency.
For a deeper look at how screener filters can be built to catch these patterns before they become portfolio problems, the Stock Screener Criteria Builder at aistockpickerapps.com walks through the logic step by step.
ETF Screener vs. Mutual Fund Screener: What Changes for Income Investors?
An ETF screener and a mutual fund screener filter by similar metrics, but ETFs have structural features that make the income analysis different. ETFs trade intraday, publish NAV daily, and distribute capital gains less frequently than mutual funds because of the in-kind creation and redemption mechanism. That makes ETFs generally more tax-efficient than comparable mutual funds for income investors.
The bigger difference for this analysis is disclosure timing. ETF issuers like YieldMax publish 19a-1 notices before or around the distribution payment date, giving investors a chance to see the ROC breakdown before the cash hits their account. Mutual fund 19a-1 notices follow the same SEC rule but are often published later and are harder to find on fund company websites.
For a fund ETF comparison, ETF.com and Morningstar both offer side-by-side tools. Neither platform currently surfaces return of capital percentage as a sortable column in their main ETF screener interface. That is the gap that makes the five-step manual check in this guide necessary.
What Metrics Should I Look for When Screening ETFs for Income?
A well-built ETF screener setup for income investing goes beyond yield. The metrics that actually matter, in rough order of importance:
- SEC 30-day yield rather than trailing distribution yield. The SEC yield reflects actual net investment income and is a better proxy for what the fund can sustainably pay.
- Total return (1-year and 3-year) alongside distribution yield. The gap between these two numbers is your first ROC signal.
- Expense ratio. For passive income ETFs, anything above 0.20% needs justification. For active or options-income ETFs, check whether the higher cost shows up in better risk-adjusted returns.
- NAV trend (3-year minimum). A flat or rising NAV suggests the fund is not eroding its asset base to pay distributions.
- Distribution history. Consistent, growing distributions over multiple years signal a fund that earns what it pays. Erratic or declining distributions signal the opposite.
- Assets under management. Funds below $100 million AUM carry liquidity risk and are more likely to be closed or merged. ETF.com and Morningstar both filter by AUM.
- 19a-1 notice ROC percentage. Not available in any screener column. Must be pulled from the fund issuer's website.
For investors building a systematic screening process, the AI investment screener comparison at aistockpickerapps.com covers which tools automate parts of this workflow.
Best Free ETF Screener Tools for Income Investors
The best free ETF screener for income investors depends on what you need to see. No single free tool shows everything. Here is what each major platform covers and where it falls short.
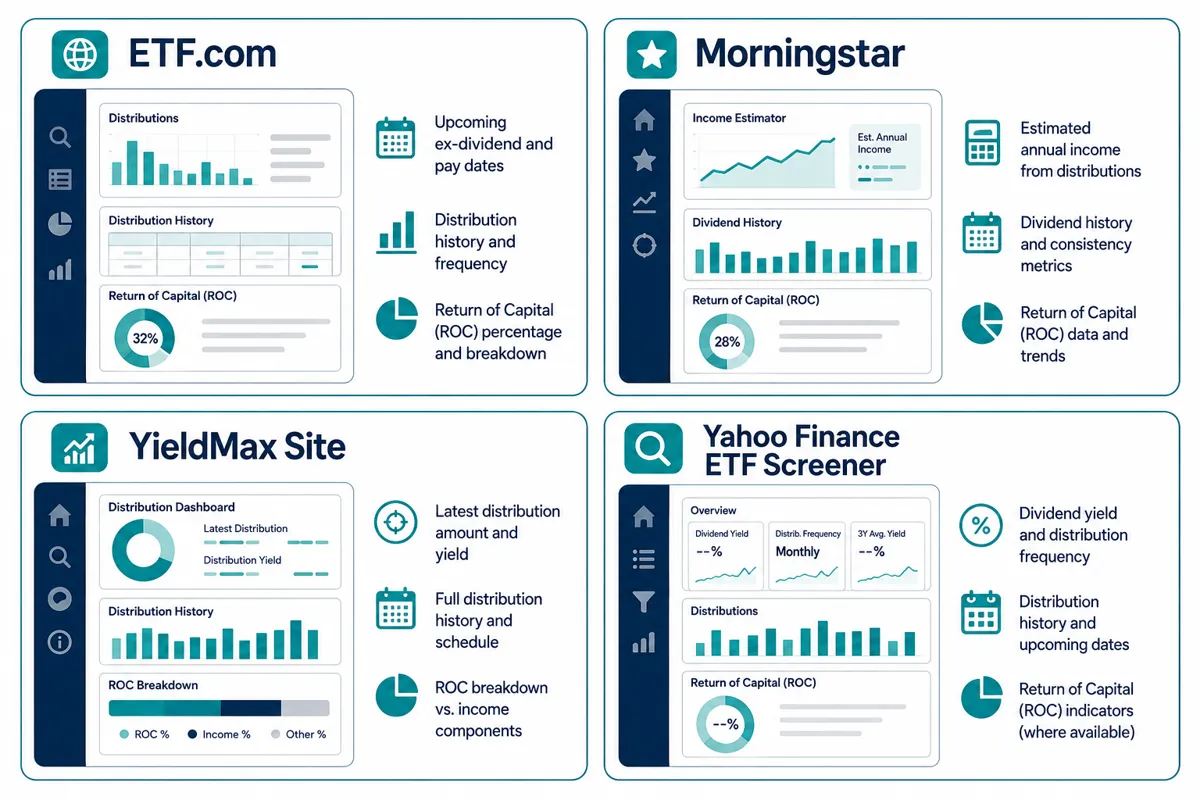
ETF.com ETF screener: The most detailed free tool for ETF-specific data. Shows distribution yield, SEC yield, NAV history, expense ratio, and full distribution history. Does not show ROC percentage as a column. Strong for steps 1, 3, and 5 of the detection method above.
Morningstar ETF screener: Adds analyst ratings and sustainability scores. The Morningstar ETF screener shows trailing returns alongside yield, which makes the yield-vs-total-return comparison easy. Premium features require a subscription, but the core data is free.
Yahoo Finance ETF screener: Fast and simple. Good for initial filtering by category and yield. Limited distribution detail. Best used as a first pass before moving to ETF.com or Morningstar.
Fidelity ETF screener: Strong integration with brokerage accounts. Shows distribution history and expense ratio. Requires a Fidelity account for full access.
Schwab ETF screener: Similar to Fidelity. Good for Schwab account holders. Includes ETF selection tools that compare funds side by side.
TradingView: Primarily a charting platform, but the TradingView ETF screener is useful for visualizing NAV trends and price history. Less useful for distribution breakdown.
None of these tools surface return of capital percentage as a sortable filter. For that data, you go directly to the fund issuer's website and read the 19a-1 notice. That is not a flaw in the screeners. It is a reminder that an ETF screener is a starting point, not a complete due diligence tool.
For a head-to-head comparison of screener tools beyond ETFs, Stock Rover vs. Finviz covers which platform gives more for your money across different use cases.
ETF Screener for Income Investing: SCHD vs. YieldMax as Worked Examples
These two fund families sit at opposite ends of the income ETF spectrum and illustrate exactly why yield alone is not enough information.
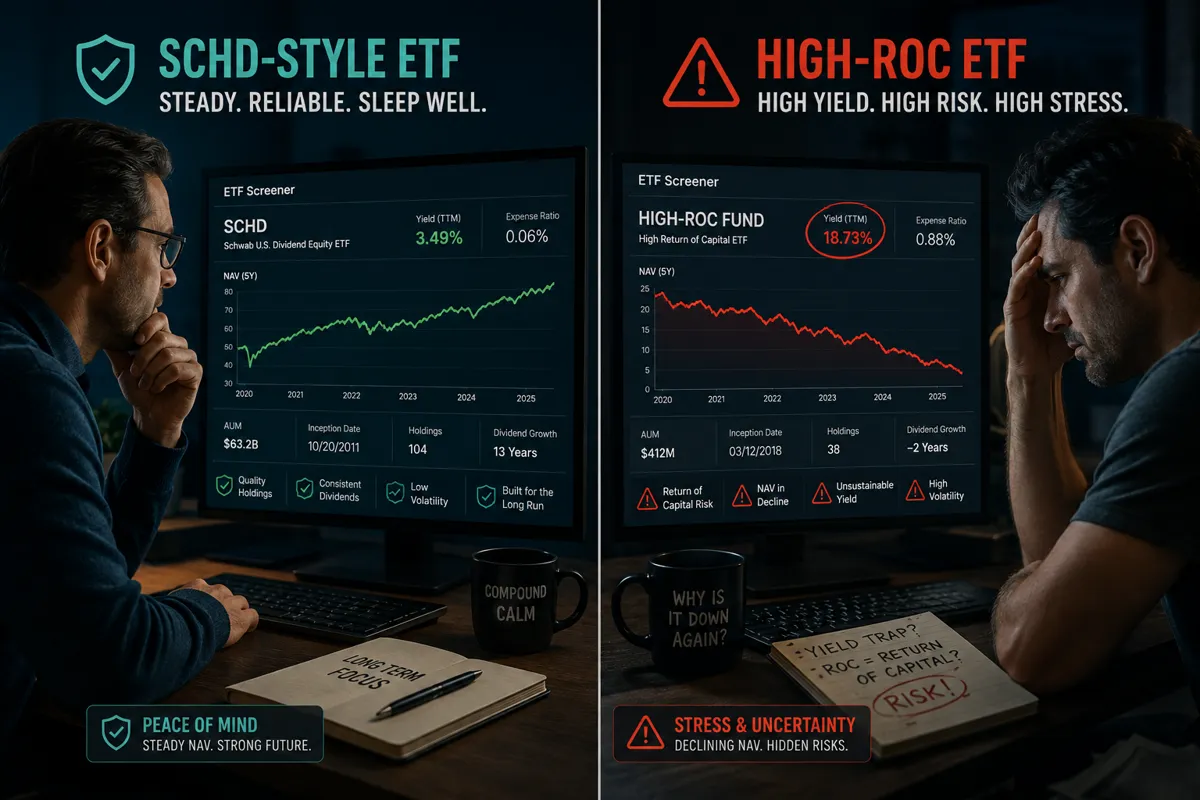
SCHD (Schwab U.S. Dividend Equity ETF) tracks the Dow Jones U.S. Dividend 100 Index, which selects stocks based on dividend growth, cash flow to debt ratio, return on equity, and dividend yield. The expense ratio is 0.06% per year. Distributions come from dividends paid by the underlying holdings. The NAV has historically trended upward over multi-year periods alongside the distributions, meaning the fund is not paying you back your own money to generate the yield. SCHD is a best dividend ETF example because the income source is transparent and the cost is low.
YieldMax ETFs use options strategies (typically selling covered calls or using synthetic positions) to generate premiums, which are then distributed to shareholders weekly. The YieldMax distribution schedule and the YieldMax 19a-1 notices show, in plain numbers, how much of each distribution is income and how much is return of capital. In August 2026, SLTY was 95.19% ROC, TEST was 88.70% ROC, and YMAG was 35.73% ROC. These are not income funds in the traditional sense. They are options-premium distribution vehicles with significant capital return components.
Neither structure is inherently wrong. They are different products serving different purposes. The point is that a yield-sorted ETF screener will rank SLTY above SCHD on yield, and most income investors will never look past that number. That is the trap.
For investors interested in how AI tools are being applied to ETF and stock selection, AI stock tools for data-driven investing covers what is actually useful versus what is noise.
How Often Should I Check My ETF Screener Results?
Running an ETF screener once and buying on the result is the setup for a bad outcome. Income-focused investors should run their screening process at least quarterly, and check 19a-1 notices before each distribution date for any fund with a significant options-income or high-yield strategy.
The reason is that ROC percentages are not fixed. YMAX's ROC component moved from 53% in early January 2026 to 25% by mid-January 2026, a significant shift in a short period. A fund that was 30% ROC one quarter can be 80% ROC the next if market conditions change and the options strategy stops generating enough premium to cover distributions.
For actively managed or options-income ETFs, check the issuer's website for 19a-1 notices before each ex-dividend date. For passive dividend ETFs like SCHD or VYM, quarterly review of total return versus distribution yield is sufficient.
The Nasdaq press release feed publishes YieldMax distribution announcements, which is another way to track changes without visiting the fund site directly.
Why Do Some ETFs Have Higher Yields Than Others?
Higher yields come from three sources, and only one of them is genuinely good news for income investors. First, a fund may hold assets that generate more income: higher-yielding bonds, stocks with large dividends, or REITs. Second, a fund may sell options against its holdings and distribute the premiums. Third, a fund may return capital to maintain a target distribution level when earnings fall short.
The first source is sustainable as long as the underlying holdings continue to pay. The second is sustainable as long as the options strategy generates enough premium to cover distributions and expenses without eroding NAV. The third is not sustainable and will eventually result in a lower share price, a distribution cut, or both.
An ETF screener cannot tell you which of these three sources is driving a fund's yield from the yield column alone. That is why the five-step check exists. Process over prediction: run the check before you commit capital, not after you have been collecting distributions for six months and notice the share price has dropped 20%.
For investors who want to build a repeatable screening system rather than running one-off checks, drowning in screener filters: the only setup you need covers how to cut the noise and keep the process clean.
FAQ
What is the best ETF screener?
The best ETF screener depends on your specific need. For free, no-login access with strong distribution data, ETF.com's ETF finder is the most detailed. For analyst ratings alongside yield data, Morningstar's ETF screener adds context. For brokerage integration, Fidelity and Schwab both offer capable tools. No screener currently shows return of capital percentage as a sortable column, so the 19a-1 notice check must be done separately on the fund issuer's website.
What is the 7% rule in ETF?
The 7% rule is an informal guideline sometimes cited in income investing circles: if an ETF's distribution yield significantly exceeds the expected long-term total return of its underlying asset class (roughly 7% for broad equity markets over time), the excess is likely coming from return of capital rather than genuine income. It is a rough heuristic, not a precise formula. A fund yielding 15% when its underlying assets historically return 7% annually is almost certainly eroding its asset base to fund the difference.
What is an ETF screener?
An ETF screener is a filtering tool that lets investors sort and narrow a universe of exchange-traded funds by specific metrics such as yield, expense ratio, asset class, assets under management, and index tracked. Free ETF screener tools are available on ETF.com, Yahoo Finance, Morningstar, Fidelity, Schwab, and Vanguard. The screener surfaces candidates based on the filters applied, but it does not evaluate the source or sustainability of distributions. That analysis requires additional steps beyond what any screener column shows.
What did Warren Buffett say about ETFs?
Warren Buffett has repeatedly recommended low-cost index fund ETFs as the best option for most individual investors. In his 2013 letter to Berkshire Hathaway shareholders, he stated that his instructions for the cash left to his wife's trustee were to put 90% in a very low-cost S&P 500 index fund and 10% in short-term government bonds. He has specifically cited Vanguard as an example of a low-cost provider. Buffett has never endorsed high-yield options-income ETFs or any fund strategy that relies on return of capital to maintain distributions.
Conclusion
Sorting an ETF screener by highest yield and buying the top result is one of the most common and most expensive mistakes in income investing. The yield column does not tell you whether the distribution came from dividends, options premiums, or your own principal. That information is in the 19a-1 notice, the NAV trend, and the SEC yield, none of which appear as default columns in any major ETF screener.
The five-step check in this guide takes about five minutes per fund. Compare distribution yield to total return. Read the 19a-1 notice. Check the NAV trend over three or more years. Look at income coverage. Check the expense ratio against what the fund actually delivers. Do that before you buy, not after you have been collecting what you thought was income and notice the share price has been declining.
YieldMax publishes its ROC percentages openly. SLTY at 95.19% ROC, TEST at 88.70% ROC, YQQQ at 89.45% ROC: these are not hidden. They are disclosed in plain numbers on the fund pages and in 19a-1 notices. The trap is not that the information does not exist. The trap is that the ETF screener you are using does not show it, and most investors never go looking.
Systems over hacks. Run the process every time. Cut the noise, keep the alpha.
One tool reviewed in depth here. There are 200+ more AI stock tools catalogued in the FullStack Alpha directory, filterable by category, price, and what they actually do. Browse the directory at aistockpickerapps.com.
Affiliate disclosure: FullStack Alpha may earn a commission from some links in this article at no additional cost to you.
References
YieldMax 19a-1 Notice 7.23.26 Payable Group 1 - https://yieldmaxetfs.com/wp-content/uploads/TaxDocuments/Group_1_Supplemental%20and%20Tax%20IRS%20Form%208937/YieldMax%2019a-1%20Notice%207.23.26%20Payable%20-%20Group%201.pdf
YMAX Distribution History - https://vestoroak.com/etf/ymax
SLTY ETF Page - https://yieldmaxetfs.com/our-etfs/slty/
YMAX ETF Page - https://yieldmaxetfs.com/our-etfs/ymax/
YMAG ETF Page - https://yieldmaxetfs.com/our-etfs/ymag/
YieldMax Distribution Schedule - https://yieldmaxetfs.com/distribution-schedule/
TEST ETF Page - https://yieldmaxetfs.com/our-etfs/test/
Nasdaq Press Release YieldMax Distributions 2026-07-06 - https://www.nasdaq.com/press-release/yieldmaxr-etfs-announces-distributions-msst-nvit-and-test-2026-07-06
YieldMax ETFs Homepage - https://yieldmaxetfs.com/
Eaton Vance Closed-End Fund Distribution Notices 19a - https://www.eatonvance.com/resources/closed-end-fund-distribution-notices-19a.html