52-Week Highs This Week: 31 S&P 500 Stocks Breaking Out
52-Week Highs This Week: 31 S&P 500 Stocks Breaking Out and What Is Driving Them
Last updated: November 17, 2026
Quick Answer
Thirty-one S&P 500 stocks printed new 52-week highs this week while the index itself was down about 3.1% over the trailing month . The leaders skew defensive and cash-rich: Costco (COST), Coca-Cola (KO), Procter & Gamble (PG), McKesson (MCK), Cboe Global Markets (CBOE) and Duke Energy (DUK). The driver isn't a tech melt-up. It's earnings beats, raised guidance, and capital returns at a moment when the broad tape is choppy. A new high is a starting point for research, not a buy signal.
Key Takeaways
- 31 S&P 500 names hit 52-week highs while the index returned roughly -3.1% over the same month . Money rotated, it didn't leave.
- Costco, Coca-Cola and Procter & Gamble were the largest breakouts by market cap at roughly $494.5B, $428.1B and $402.0B, with one-month gains of 12.8%, 5.9% and 9.3% .
- Cboe Global Markets posted the biggest percentage move on the list at about 19.8% in a month .
- Nearly every leader had a hard catalyst: an earnings beat, raised guidance, or a shareholder payout. No vibes.
- A 52-week high is a screen, not a setup. The tradeable version needs a base, a trigger, and a stop.
- Breakouts into weak broad-market breadth fail more often. Position sizing matters more here, not less.
- Defensive leadership (staples, healthcare distribution, regulated utilities) usually means the market is paying up for predictable cash flow.
Why Are 31 S&P 500 Stocks Hitting 52-Week Highs While the Index Falls?
Because this is rotation, not a rally. The S&P 500 returned about -3.1% over the trailing month, yet 31 of its members made new annual highs . That combination tells you capital is leaving growth-sensitive, high-multiple names and parking in businesses with boring, predictable cash flow.
The sector mix says it loudly:
- Consumer staples (Costco, Coca-Cola, Procter & Gamble), defensive demand, dividends.
- Healthcare distribution (McKesson), volume-driven, margin-stable.
- Exchanges (Cboe), volatility is literally their product.
- Regulated utilities (Duke Energy), rate-based earnings, dividend support.
That's a classic late-cycle lineup. When the index falls and staples hit highs, the market is pricing risk, not growth.
Practical takeaway: Narrow breadth cuts both ways. Fewer leaders means less room for error if one of them cracks. Trim size, don't add it.
What's Driving the Three Biggest 52-Week Highs This Week?
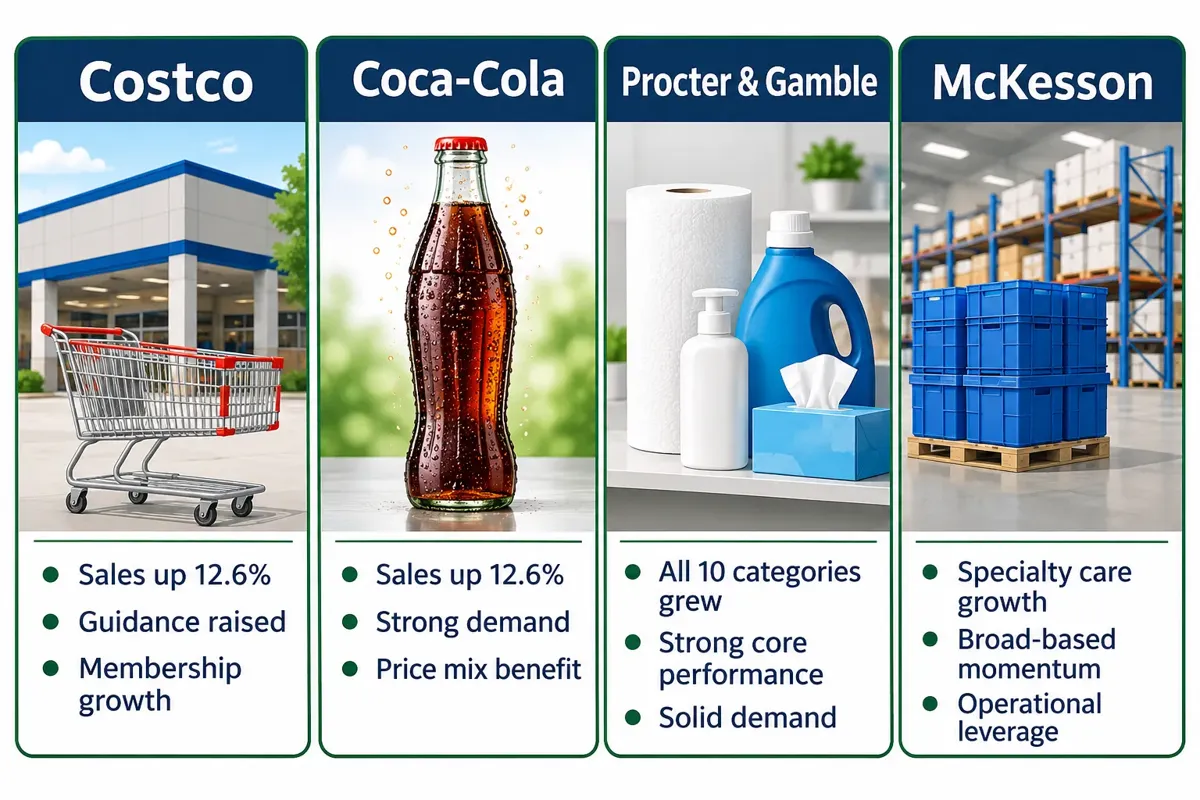
Fundamentals, not momentum chasing. All three mega-cap leaders had reported numbers that beat and guidance that held or improved.
Market caps and one-month returns from the breakout screen .
Costco did more than beat. Quarterly EPS came in at $6.75 against a $6.54 consensus on revenue of $95.72B versus $94.97B expected. Management announced a $30-per-share special dividend payable December 4, 2026, alongside discussion of a roughly $4 billion buyback. Forward estimates stayed strong, with consensus near $4.87 adjusted EPS and $74.3B revenue for the November quarter, about 12% EPS growth.
Coca-Cola raised its 2026 comparable EPS outlook for the third time, now guiding to at least 11% growth off a $3.00 base. Volume growth of 5% matters more than price here, because volume growth is harder to fake than price increases.
Procter & Gamble grew across every category and every region. Broad-based growth is the tell that this wasn't one hot product line carrying the quarter.
Decision rule: If a stock makes a new high with no earnings, guidance, or capital-return catalyst behind it, treat it as a momentum move with a shorter leash. Catalyst-backed highs hold better.
Which Mid-Cap Breakouts Deserve a Second Look?
Cboe and McKesson, because both had a structural story and not just a good quarter.
Cboe Global Markets (CBOE) was the strongest percentage mover on the list, up about 19.8% in a month . Third-quarter net revenue rose 18% to $712.2 million and adjusted EPS climbed 36% to $3.63. The company raised its 2026 organic revenue growth outlook to the high-teens percentage range, extended its exclusive S&P Dow Jones Indices licensing agreement through 2051, and reported Global Trading Hours volume growth above 130%.
A 25-year index licensing extension isn't a quarter. That's a moat with a timestamp on it.
McKesson (MCK) reported fiscal Q2 revenue of $111.0 billion, up 8%, with adjusted EPS of $11.68, up 18%. Management raised fiscal-2027 adjusted EPS guidance to $45.60,$46.40 from $44.20,$45.00. The specialty-care platform and an extended CVS Health distribution agreement underpin the move. The stock had gained more than 30% in 2026 while still trading below its five-year median valuation multiple.
Duke Energy (DUK) rounds out the defensive side with Q3 2026 adjusted EPS of $1.99. Regulated utilities hitting highs is a sentiment reading as much as a stock story.
Common mistake: Buying the biggest percentage gainer on a 52-week-high list without checking whether the move already front-ran the fundamentals. Cboe up 19.8% in a month is overextended by definition. The question is whether it builds a new base or gives it back.
How Do You Tell a Real Breakout From a Short-Term Spike?
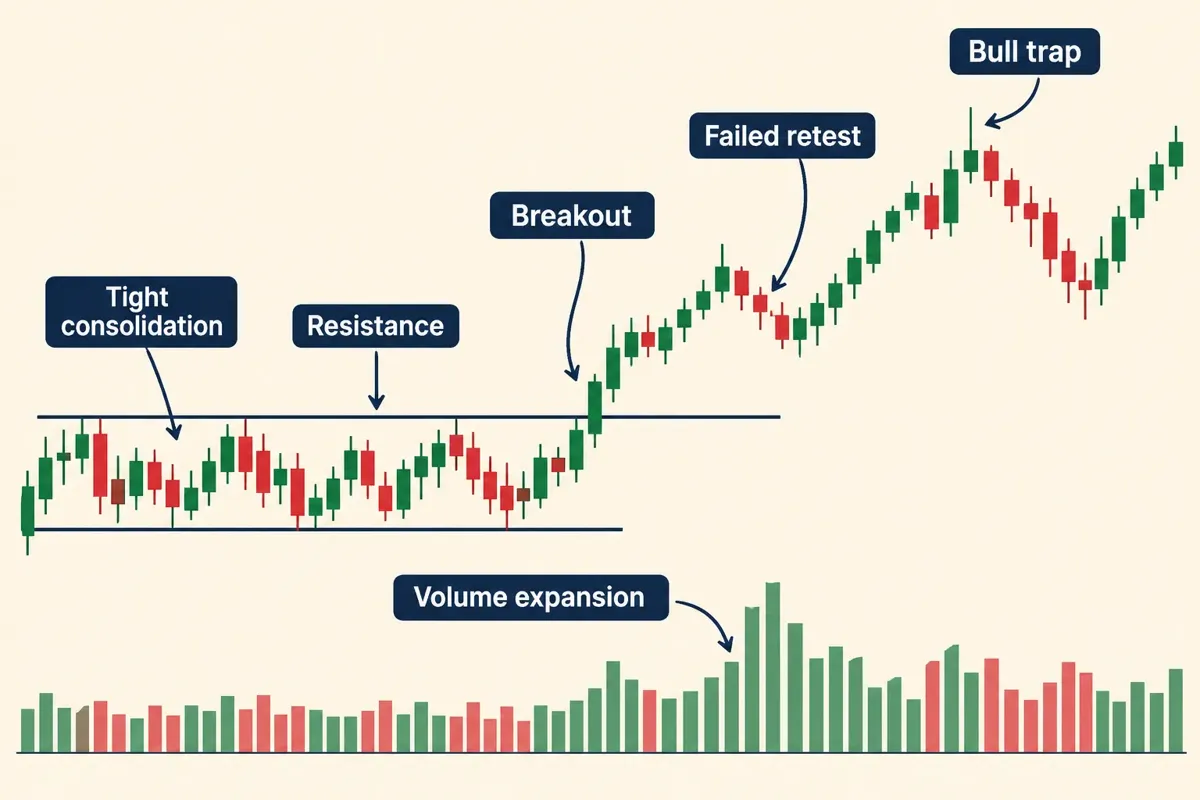
A real breakout comes out of a tight consolidation on expanding volume and then holds above the old resistance level. A spike jumps, fades, and closes back inside the prior range.
Quick definitions, since nobody should have to guess:
- Resistance, the price ceiling where sellers have repeatedly shown up.
- Tight consolidation (basing), a quiet sideways range with shrinking daily swings. Means supply and demand are balanced before a decision.
- Bull trap, a breakout that sucks buyers in, then reverses hard below the breakout level.
- Overextended, price stretched far above its moving averages with no rest. More risk per dollar of upside.
Four checks before you touch a name on a 52-week-high list:
- Was there a base? A multi-week range before the move is far better than a vertical ramp off the lows.
- Did volume confirm? Breakout day volume meaningfully above average suggests institutions, not retail chasing.
- Is there a catalyst you can name in one sentence? Costco's special dividend qualifies. "It looked strong" doesn't.
- Where's your invalidation? If you can't point to a price that proves you wrong, you don't have a trade.
Edge case: Defensive breakouts in a down tape often grind rather than run. If your plan requires a fast 10%, staples breakouts are the wrong vehicle. Match the setup to the expected speed.
How Should You Build a Watchlist From 52-Week Highs This Week?
Treat the 31 names as raw input, then filter down to three or four you'd actually trade. Scanning everything is how analysis paralysis starts.
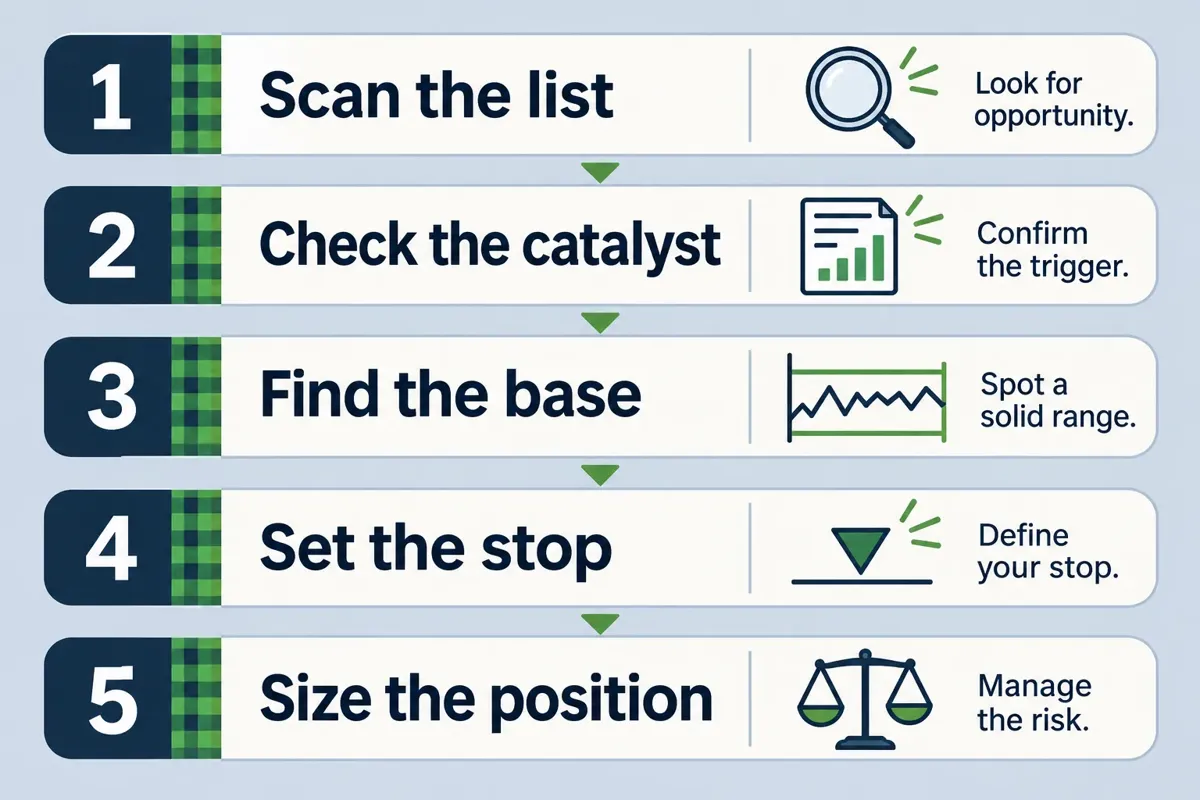
A workable five-step filter:
- Scan the list. Pull the full set of S&P 500 names at new highs. Weekly WSJ and exchange screens publish these .
- Check the catalyst. Earnings beat, raised guidance, buyback, or dividend. No catalyst, no spot on the list.
- Find the base. Look for a consolidation of at least two to three weeks before the move. Vertical charts get cut.
- Set the stop before the entry. Below the breakout level or the prior swing low. Pick it first, or you'll move it later.
- Size from the stop, not from conviction. Risk a fixed, small percentage of the account per trade. Distance to stop determines share count.
If you'd rather automate the first three steps, a stock screener built for swing trading handles the filtering, and our breakdown of the best AI stock screeners of 2026 covers which ones actually surface movers in time to act on.
What Are the Risks of Buying 52-Week Highs?
The main risk is paying for a move that already happened. Breakouts fail regularly, and they fail more often when the broader index is falling and breadth is narrow.
Specific risks worth naming:
- Failed breakouts. Price clears resistance, stalls, and reverses. Your stop handles this if you set one.
- Valuation stretch. McKesson trading below its five-year median multiple is a different risk profile from a name trading at a record multiple.
- Crowding. Defensive leadership in a weak tape attracts a lot of the same buyers. Crowded trades unwind fast when sentiment flips.
- Chasing after a guidance raise. The guidance is already in the price by the time it hits the 52-week-high list.
- Revenge trading after a failed breakout. Taking a bigger position on the next name to make back the loss. That's how small accounts get cooked.
Decision rule: Buy a breakout only if the stop loss, meaning the price where you exit and admit the idea failed, is close enough that the loss is small relative to the realistic upside. If the nearest sensible stop is 12% away, the risk-reward isn't there. Skip it.
Automating this doesn't remove the judgment call, something worth reading about in our guide to what to know before you automate trades with AI bots.
Who Should Trade Breakouts and Who Shouldn't
Breakout trading suits swing traders with a defined holding period and a written risk rule. It's a poor fit for anyone who can't sit with a position that goes against them by 3% on day two.
Good fit if you:
- Hold positions days to weeks and check charts once or twice a day.
- Already size positions from a stop, not a gut feeling.
- Can skip 28 of the 31 names without feeling like you're missing out.
Bad fit if you:
- Need the position to work immediately.
- Add to losers.
- Have no written rule for when you exit.
Paper trade it first if you've never traded a breakout through a down tape. Watching a defensive name grind sideways for three weeks teaches patience cheaply.
For longer-horizon investors, the same 52-week-high list works as a quality screen rather than a timing tool. Comparing how these filters differ across asset types is covered in our piece on AI ETF screeners versus stock screeners. And if you want to pressure-test setups without paying for another subscription, the free trading tools and calculators cover position sizing and risk math.
FAQ
What is a 52-week high?
The highest price a stock has traded at over the past 52 weeks. It's a momentum marker, showing that no buyer from the last year is currently underwater.
Does a 52-week high mean a stock is overvalued?
No. A stock at a 52-week high can still trade below its historical valuation multiple. McKesson gained over 30% in 2026 while still trading below its five-year median multiple.
How many S&P 500 stocks hit 52-week highs this week?
Thirty-one S&P 500 stocks made new 52-week highs, with Costco, Coca-Cola and Procter & Gamble the largest by market capitalization .
Which stock had the biggest move among this week's 52-week highs?
Cboe Global Markets gained roughly 19.8% over one month, the largest percentage move cited among the 31 names .
Why were defensive stocks leading the breakouts?
Because the S&P 500 returned about -3.1% over the same month . Investors rotated toward staples, healthcare distribution and regulated utilities for predictable cash flow.
Is a special dividend a reason to buy a stock?
It's a signal of balance-sheet strength, not a free lunch. Costco's $30-per-share special dividend, payable December 4, 2026, reflects cash generation. The share price typically adjusts on the ex-dividend date.
Where can I find the weekly list of new 52-week highs?
Exchange and market-data pages publish them daily and weekly, including the Wall Street Journal's new highs and lows table and S&P 500 screener tools .
What's the most common mistake traders make with breakouts?
Entering without a predefined stop loss. Without one, a failed breakout turns into a long-term hold you never intended, which is how small accounts get destroyed.
Conclusion
Thirty-one S&P 500 names at 52-week highs against a -3.1% index month is a rotation story, and the names leading it, Costco, Coca-Cola, Procter & Gamble, McKesson, Cboe, Duke Energy, all carry a catalyst you can state in one sentence. That's the filter that matters.
Three things to do this week:
- Pull the list yourself and cut it to names with a named catalyst. You should be left with four or five, not 31.
- Draw the base and the stop on each survivor before you look at the entry price.
- Write the size down before the market opens. Discipline beats prediction every time.
The trend is your friend right up until it isn't, and the only thing separating those two moments is whether you wrote a stop down first.
One week of breakouts examined here. 200+ AI stock tools are catalogued in the FullStack Alpha directory, filterable by category, price and what they actually do.
Browse the directory → aistockpickerapps.com
References
- 31 S&P 500 Stocks Just Made New 52-Week Highs (2026). trefis.com.
- New 52-Week Highs and Lows, Wall Street Journal Market Data (2026). wsj.com.
- New High 52W Screener Overview, S&P 500 (2026). tradmap.com.