Tweezer Top Candlestick Patterns: 3 Checks Before Shorting

Quick Answer: Tweezer top candlestick patterns are two-candle formations with matching highs after an uptrend, and they warn that an advance may be stalling, but a short needs trend context, a confirmed breakdown, and a defined stop and position size. Matching peaks alone don’t prove sellers control the trade; TMGM recommends waiting for a close below the formation’s lowest low.
Tweezer top candlestick patterns: key takeaways
A tweezer top belongs on the watchlist before it belongs in an order ticket. These checks turn an attractive picture into a decision you can repeat.
- TMGM: The usual formation contains 2 consecutive candles with equal or nearly equal highs after an advance.
- FBS: A top suggests bearish reversal potential; a bottom suggests bullish reversal potential. Neither guarantees follow-through.
- TMGM: The first candle is typically bullish and the second candle bearish, but rejection and location deserve more attention than color alone.
- TMGM: A 4-hour or daily chart can suit swing traders better than a 5-minute or 15-minute chart crowded with occurrences.
- IG: Different reversal structures require different definitions. Don’t combine their occurrences into a single success-rate claim.
- FullStack Alpha: Educational material should help you define risk, not sell certainty. Paper trade it first.
What are tweezer top candlestick patterns?
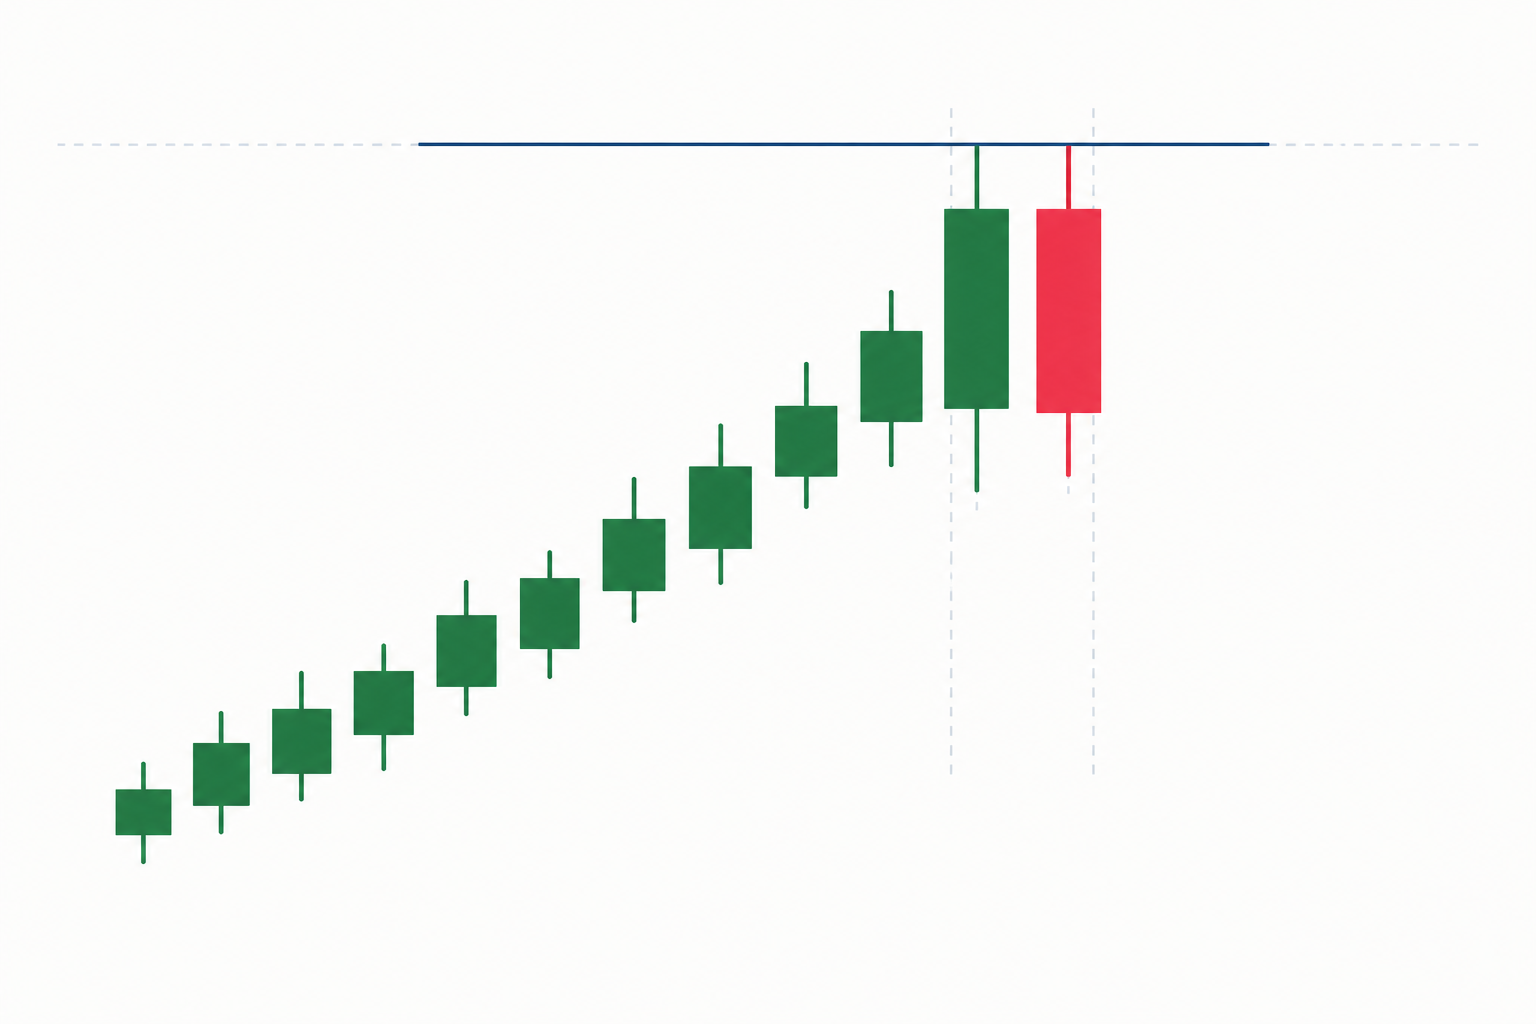
Tweezer top candlestick patterns are potential bearish reversals formed when consecutive candlesticks reject roughly the same high after an uptrend. The shared ceiling suggests resistance, but the market must still break lower to confirm the trading idea.
How do you identify the formation?
Start with the advance, then inspect the upper wicks. The familiar version has 2 candlesticks: candle 1 pushes upward, while candle 2 revisits the ceiling and retreats. A later confirmation candle completes the decision process described below.
The shared high need not look like a ruler drew it. “Nearly equal” requires a written tolerance, though. Otherwise, your eye accepts attractive occurrences and rejects inconvenient occurrences.
Record the number of ticks separating the peaks. Keep that number fixed across your testing period, except when a documented instrument specification requires a change. A scanner that silently changes the tolerance changes the pattern.
Color helps you read buying and selling within the session. Color cannot establish that the whole uptrend has ended. A green candle followed by a red candle in tight consolidation, meaning a narrow sideways range, may be ordinary churn.
Tweezer top versus tweezer bottom
A tweezers top tests resistance after an advance. A tweezers bottom tests support after a decline. Tops carry bearish implications; bottoms carry bullish implications.
Both have 2 principal candles, but matching highs and matching lows tell different stories. Neither deserves an automatic trade just because the shape appears.
A bottom during basing, where selling pressure settles into a range, differs from catching a falling knife during an accelerating decline. A top during a failed advance differs from a pause before the breakout.
Compare nearby reversal structures
IG describes a shooting star as a 1-candle structure, bearish engulfing as 2 candles, and an evening star as 3 candles. TMGM describes the standard tweezers formation using 2 candles. These counts describe construction, not reliability.
| Formation | Candles needed | What it signals | Confirmation to consider | Reliability notes |
|---|---|---|---|---|
| Tweezer top | 2 | Repeated ceiling rejection | Close below the pair’s lowest low | Depends on location and execution |
| Shooting star | 1 | Upper-wick rejection | Follow-through below the rejection | A long wick alone is insufficient |
| Bearish engulfing | 2 | Selling body overtakes prior buying body | Weakness after the completed formation | Body size and prior trend matter |
| Evening star | 3 | Advance stalls, then retreats | Completed reversal and viable downside room | Gap requirements vary by definition |
What are the 3 rules before you short a tweezer top?
Think of these as three locks on the same door: context, confirmation, and cost.
Short only when the formation follows a relevant advance, sellers confirm the rejection, and the planned loss fits your account. These are separate gates: a good-looking formation cannot compensate for an untradeable entry.
Rule 1: Check context and trend
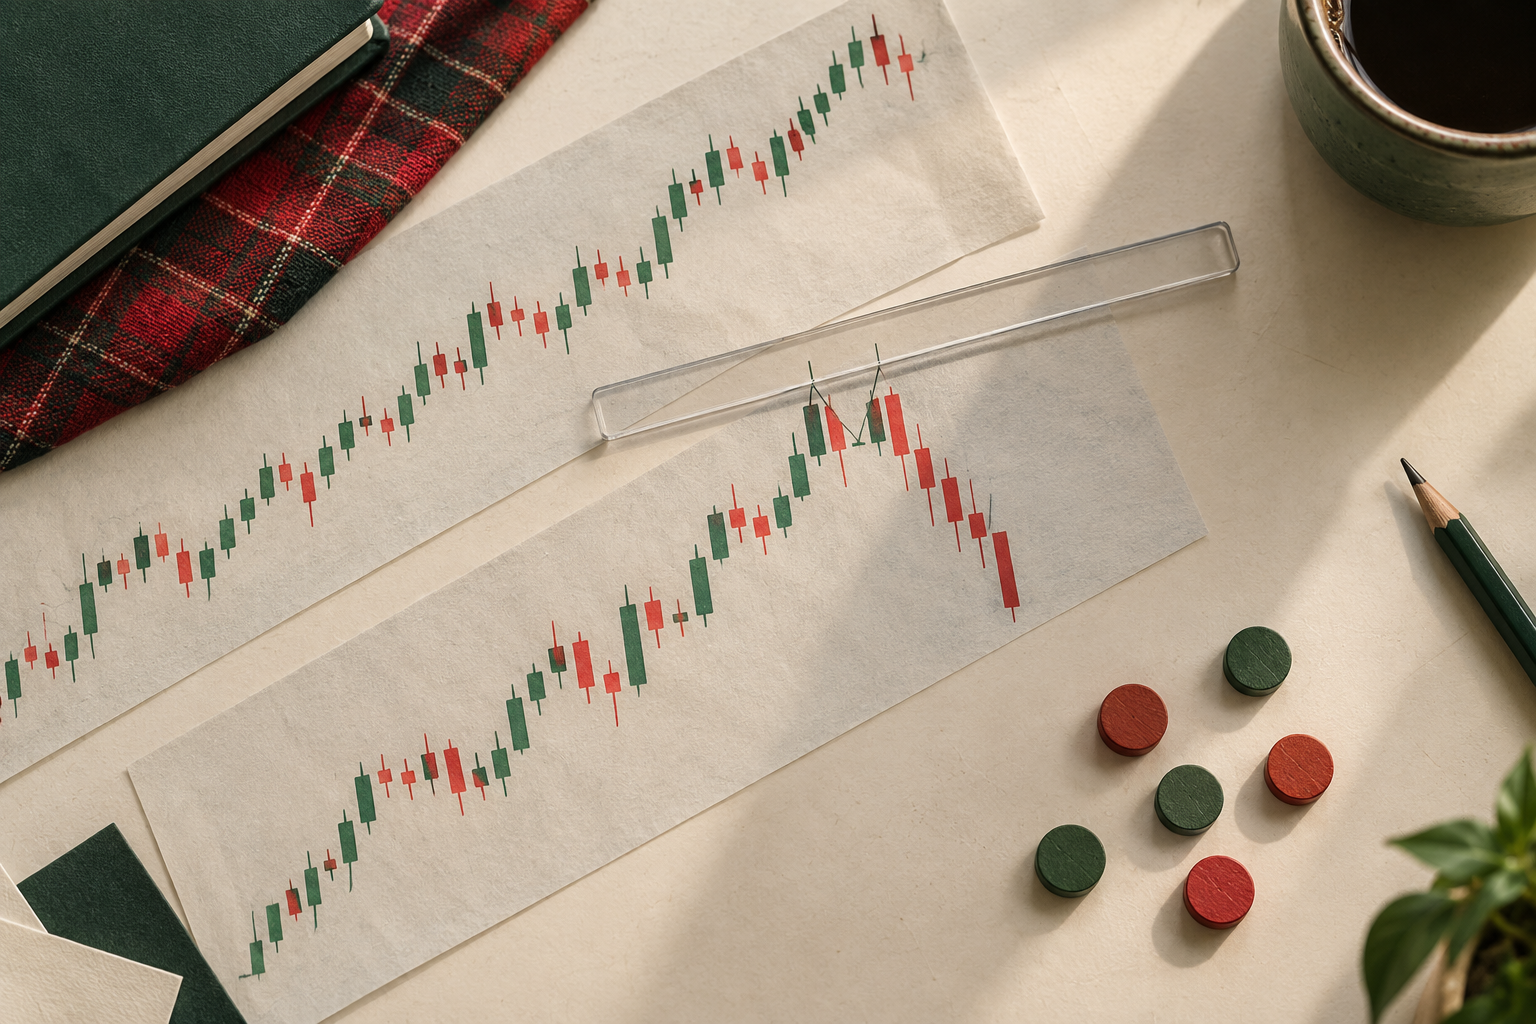
Require an uptrend into identifiable resistance. Mark support and resistance before inspecting the formation; otherwise, you’ll draw the line wherever your preferred trade needs it.
TMGM describes the first upward candle and second downward candle as a rejection sequence after an advance. Matching peaks in the middle of a range have less directional context.
Ask whether the stock is overextended, meaning stretched beyond its recent trading range, or merely pausing. The trend is your friend until evidence supports a change. A tweezers pattern is evidence to investigate, not permission to argue with persistent buying.
For market context, Reuters’ September 21, 2026 report described an approximately 4% retreat from August peaks and a recovery above the 50-day average. It placed support around 7,617, with the 100-day average near 7,520. Those levels illustrate why location matters; they don’t establish actual tweezers occurrences.
A potential bull trap occurs when the breakout attracts buyers, then fails back into the old range. That setting deserves investigation. An isolated matching high during choppy tape, meaning directionless trading, often deserves a pass.
Use a repeatable universe rather than random alerts. The guide to finding stocks for swing trading addresses that earlier screening decision.
Rule 2: Wait for confirmation, including volume context
Require the next candle to close below the lowest low of the paired candlesticks. TMGM’s stated confirmation method uses the completed close, rather than a brief intrabar dip.
That means 2 formation candles, followed by a potential third candle that confirms weakness. Candle 3 is a decision point, not a universal promise that reversals finish immediately.
A close below support shows sellers achieved something. A wick below support followed by a recovery may show the opposite.
Volume can strengthen the case if activity expands on the second candle or the subsequent confirmation candle. Compare volume with a consistent recent baseline; don’t select whichever comparison makes the setup look strongest.
Keep the distinction between exchange volume and tick volume. The latter counts quote or price changes rather than consolidated shares traded, so the data cannot be treated as equivalent.
An RSI reading above 70 can flag an overbought context, but it is not an independent short command. Strong markets can remain stretched while early shorts keep getting stopped out.
Confirmation has a drawback: it can worsen the entry. If the confirming bar travels directly into support, skip the chase. A clean setup can expire before you get a usable fill.
Rule 3: Define the stop and size before entry
Place invalidation above the shared rejection area, allowing for normal fluctuations and execution costs. Calculate the position from the distance between entry and stop loss, not from the amount of buying power available.
Shares = planned cash risk ÷ estimated loss per share.
Estimated loss per share should include the stop distance and a reasonable allowance for spread and slippage. Actual losses can exceed the plan during gaps.
For a short, the initial target normally sits above a credible support area. A gap fill, meaning a return through a prior opening gap, may provide context, but it does not create a guaranteed destination.
Worked example: entry and exit
This is hypothetical arithmetic, not a real trade or a published return. The cited guides support the workflow, not these invented demonstration inputs.
| Planning item | Illustrative value |
|---|---|
| First session: open, high, low, close | $98, $101, $97, $100 |
| Second session: open, high, low, close | $100, $101, $98, $99 |
| Confirmation close | $96.80 |
| Assumed entry | $96.70 |
| Planned stop | $101.30 |
| Stop distance | $4.60 |
| Planned cash risk | $92 |
| Position before cost adjustment | 20 shares |
| Possible support target | $87.50 |
| Gross reward per share | $9.20 |
| Gross reward relative to risk | 2:1 |
The example deliberately gives up some entry distance while awaiting confirmation. Add costs and the gross risk-reward becomes less attractive. If nearby support were much closer, passing would be sensible.
Shorting also requires borrow availability. Borrow charges, recalls, spread widening, and earnings season gaps can ruin tidy arithmetic. Low float stocks, with relatively few shares available for trading, add squeeze risk.
Before placing orders, review trading-app settings to change before your first trade. An alert should not become an accidental market order.
Chart patterns
Tweezer Top Checklist Scorer
How strong is the signal on your chart, and which confirmation is still missing?
Tick each confirmation that is true on your chart. The scorer rates signal strength and flags a missing confirmation close.
A high score is not a prediction; check borrow, earnings dates, and nearby support too. Educational tool only, not financial advice.
Who should trade tweezer top candlestick patterns: day traders, swing traders, scalpers, or long-term investors?
Your schedule decides which version of the signal you can actually trade.
The formation fits swing traders who can wait for completed bars and manage overnight exposure. Day traders and scalpers can inspect the same geometry, but execution noise matters more; long-term position investors can use it as a review prompt rather than a standalone exit command.
What is the best timeframe?
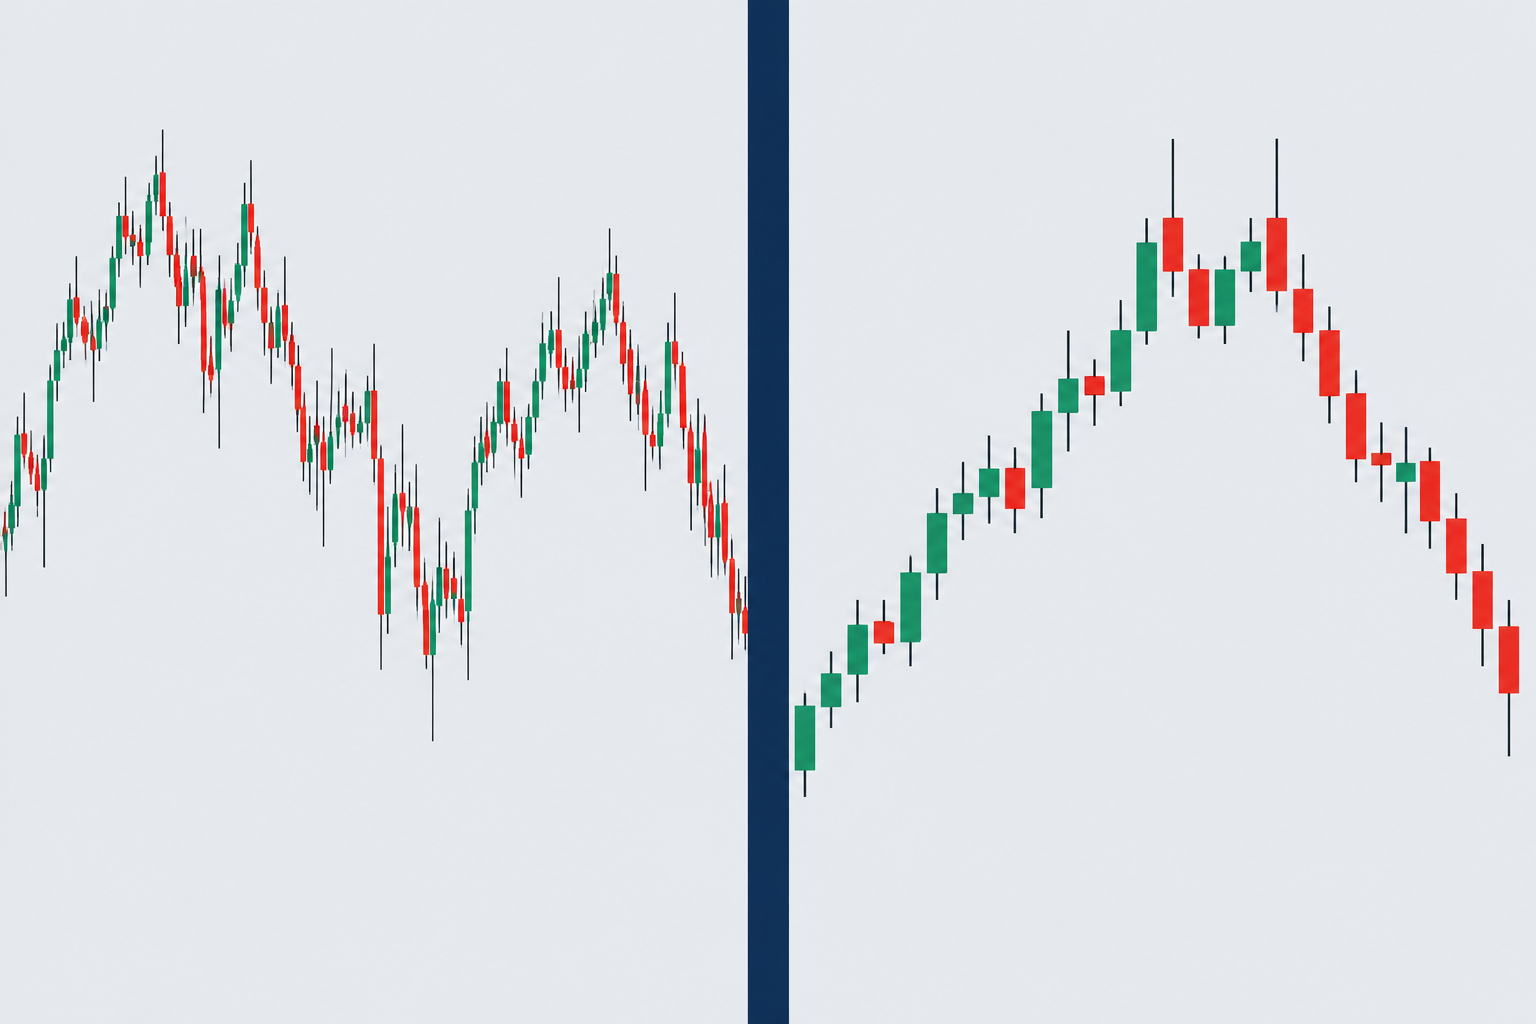
For swing trading, start with daily bars and use an intraday view only to refine an already defined plan. TMGM also discusses 4-hour charts and contrasts them with shorter 5-minute and 15-minute intervals.
More occurrences do not necessarily mean more opportunity. Shorter bars increase the number of decisions, the influence of spread, and the temptation to overtrade.
Structure: The standard formation uses 2 adjacent candles, with the first typically rising and the second typically falling. Color is descriptive, not proof.
Timeframes: Compare 4-hour and daily signals with 5-minute and 15-minute signals separately. Their occurrences belong in different samples.
Momentum: RSI above 70 can support an overbought reading. It does not measure the probability that your short will succeed.
Market location: Reuters identified a September 11 high of 7,677.02, resistance around 7,756 to 7,772, and an August 14 record near 7,816.70 in its 2026 report. These are context levels, not verified reversal occurrences.
An equity session also doesn’t divide neatly into identical intraday windows on every platform. Session settings and extended-hours data can change your candlesticks.
Avoid switching intervals until a losing idea looks attractive. A daily decision should not become a power hour gamble, meaning a trade improvised during the closing portion of the session.
Which scanners find tweezer top candlestick patterns?
Scanners that flag tweezer top candlestick patterns save screen time, but each one defines “matching highs” its own way.
A formation is a trading concept; TradingView, TrendSpider, Finviz, and thinkorswim are tools for finding, inspecting, or trading candidates. Choose software around your workflow, then verify that its current settings recognize the exact geometry you intend to trade.
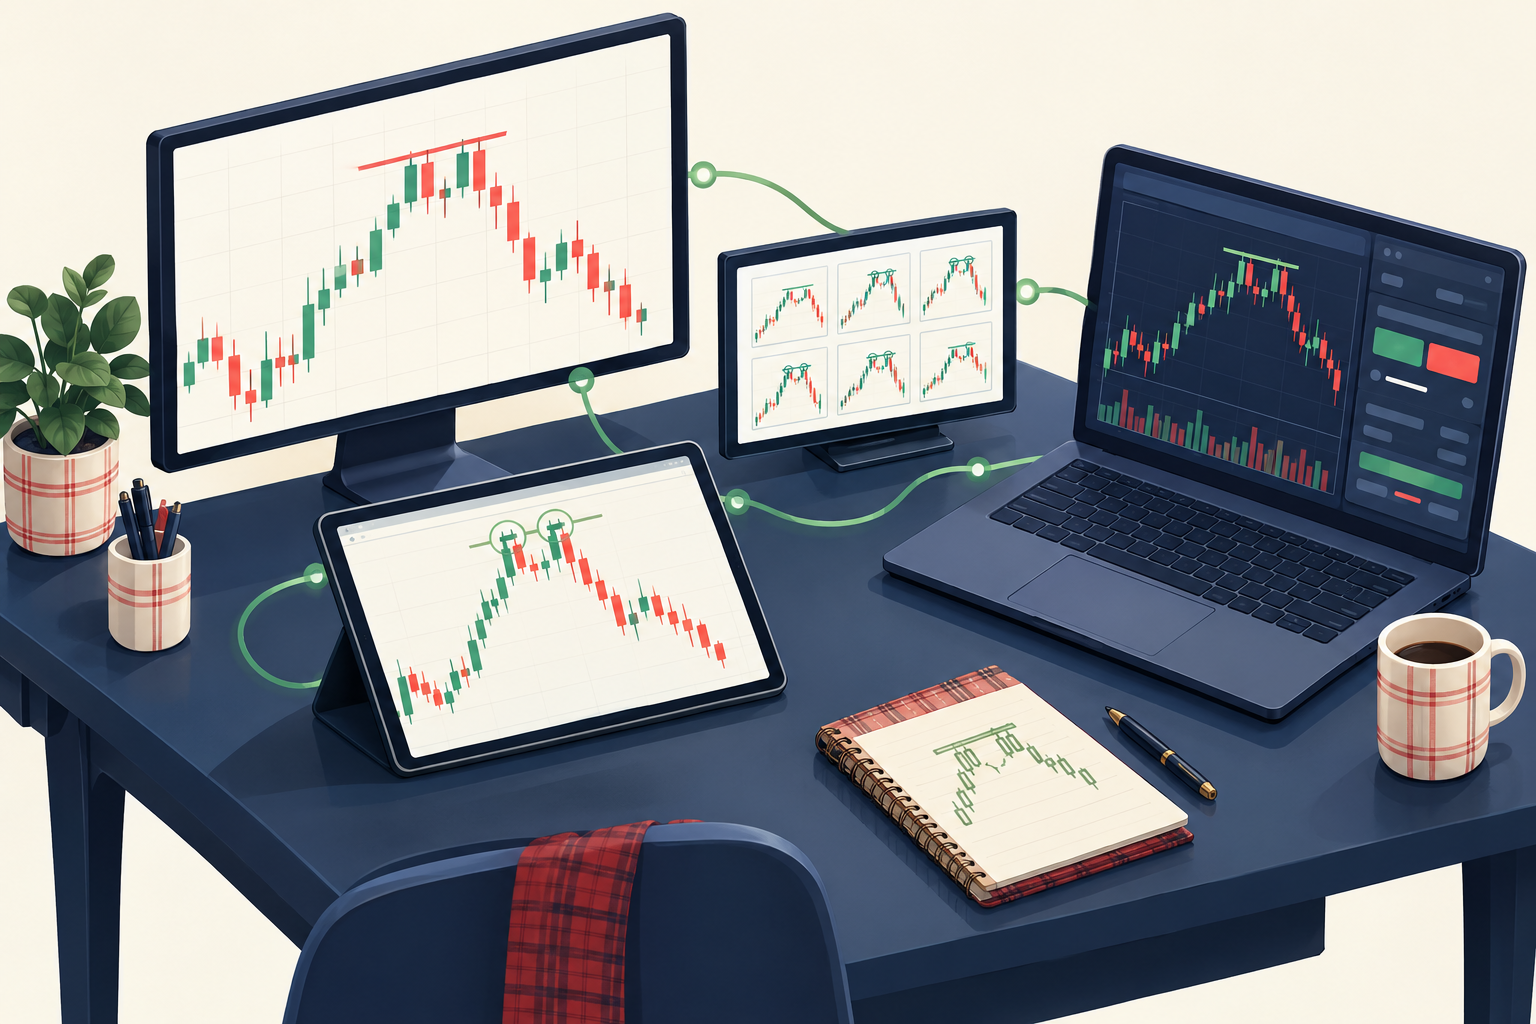
- TradingView: Fits traders who want flexible charts and alerts. Verify the script’s definitions; a community indicator is not an audited research result.
- TrendSpider: Fits traders seeking automated technical scanning. Check current pattern coverage, timeframe restrictions, and the meaning of each alert before paying.
- Finviz: Fits stock screening and narrowing a watchlist. Don’t assume its pattern screener contains a dedicated tweezers detector.
- thinkorswim: Fits traders who want analysis near order entry. Custom study logic needs checking against manually inspected occurrences.
- CandleScanner: Fits readers examining candlesticks and historical occurrences. Confirm the software version, definitions, and efficiency methodology before interpreting a report.
These are workflow comparisons built from desk research and public user sentiment, not a product ranking.
A scanner can reduce the number of charts you inspect. It cannot decide whether borrow costs or tomorrow’s earnings release make the short unsuitable.
There are genuine drawbacks. Automation can flag repeated highs without useful trend context, and confirmation can arrive after the attractive entry has gone. Those problems survive a nicer dashboard.
For tool selection, compare swing-trade scanners and read what to know before automating trades. Keep software selection separate from strategy validation.
How reliable are tweezer top candlestick patterns?
Nobody has a clean, universal number, and anyone quoting one owes you the sample behind it.
The educational sources cited here do not establish a universal, independently verified success rate for tweezer top candlestick patterns. Reliability depends on the definition, market, testing period, entry, exit, costs, and which occurrences enter the sample.
Published explanations describe rejection and confirmation, but that is different from proving profitable execution. FBS and WR Trading discuss the formation as a conditional reversal signal.
What do success-rate statistics need to disclose?
A useful report states the number of occurrences detected, the number of occurrences confirmed, and the number of occurrences actually tradeable. Those are different denominators.
It also separates:
- Gross occurrences from non-overlapping occurrences.
- Winning occurrences from losing occurrences.
- Historical occurrences from forward-recorded occurrences.
- Signal frequency from net profitability.
- The average winning trade from the average losing trade.
Call the final measurement “efficiency” only after defining it. Efficiency might mean directional follow-through, target achievement, or another vendor-specific calculation. Efficiency is not automatically a win rate.
A high efficiency reading can coexist with poor returns if losses exceed gains. A high number of occurrences can also hide concentration in correlated stocks.
How do you avoid false signals?
Reduce false signals by requiring prior trend context, a relevant resistance line, and completed confirmation. TMGM’s close-below-the-low approach offers a concrete filter, although it cannot eliminate failed trades.
Record failed occurrences instead of deleting them as “bad examples.” Record skipped occurrences too, with the reason. News-driven occurrences and illiquid occurrences may deserve exclusion, but the exclusion must exist before seeing the outcome.
Common mistakes include changing the tolerance, judging candle color without location, entering before the close, and shorting directly above support.
Revenge trading often begins when a trader treats failure as an insult. The market did not read your annotation.
How should you test the idea?
Define candlesticks testing before collecting results. Freeze the testing period, symbol universe, signal frequency measurement, and cost model. Then preserve an untouched later period for checking the same instructions.
For each symbol, record occurrences, confirmed occurrences, rejected occurrences, and executed occurrences. Keep the average stop distance and average holding period beside net results.
Testing daily occurrences together with intraday occurrences muddies the statistics. Testing top occurrences together with bottom occurrences does the same.
The practical starting point is finding a trading edge before risking money. A persuasive screenshot is not enough evidence.
How should you judge statistics on tweezer top candlestick patterns?
An author byline or a vendor statistics panel does not validate a trading result. If a page displays CandleScanner statistics or any efficiency figure for tweezer top candlestick patterns, inspect the definitions and sample before accepting the claim.
CandleScanner output and a general patterns dictionary may classify candlesticks differently from your broker’s scanner. That difference changes occurrences, frequency, and the apparent efficiency of the same visual idea.
Read the report, not the headline
For a CandleScanner-style review, request the number of scanned symbols, number of eligible sessions, number of occurrences, and number of excluded occurrences. Then request the testing period and the rules for overlapping occurrences.
A statistics report still needs dates. An efficiency panel still needs an outcome definition. Neither heading tells you whether commissions were deducted.
Keep these fields together:
| Report field | What to check |
|---|---|
| Occurrences | Raw occurrences, unique occurrences, confirmed occurrences |
| Number | Number of trades, number of symbols, number of sessions |
| Efficiency | Defined efficiency measure and net results |
| Period | Start, end, missing sessions, later validation period |
| Frequency | Occurrences per eligible observation |
| Performing symbols | Sample size and concentration, not just winners |
Check exclusions and category labels
A “false” bucket needs a definition. So do low, medium, and high categories. Without thresholds, those categories cannot support a trading decision.
If a report excludes four-price doji bars, where open, high, low, and close are equal, find out what was removed. Exclusions change the denominator, especially in thinly traded data, so keep the rule identical across the comparison period.
CandleScanner statistics should also separate tweezers from other patterns. An illustration explains appearance; it doesn’t establish frequency.
Count the failures with the same care as the successes. Otherwise, testing becomes a scrapbook.
Top 5 checks traders use on tweezer top candlestick patterns
Run these five in order. If one fails, the trade waits.
- Prior uptrend into resistance. Matching highs in the middle of a range carry little directional meaning.
- A written tolerance. Record how many ticks can separate the two highs and keep that number fixed.
- A confirmation close. TMGM’s method waits for the next candle to close below the pair’s lowest low.
- Volume against a baseline. Expansion on the second candle or the confirmation candle strengthens the case.
- Stop and size before entry. Place the stop above the shared high and size the position from that distance, not from buying power.
FAQ: tweezer top candlestick patterns
Tweezer top candlestick patterns are useful only inside a defined trading process. These answers address interpretation and execution without assigning unsupported probabilities.
What is the most powerful candlestick pattern?
No universal winner is established by the sources cited here. A reversal structure can work differently across markets and entry methods. IG describes multiple bullish and bearish formations, but description alone does not establish comparative profitability. Prefer the structure whose occurrences you can define, record, and evaluate after costs.
What is the 3 candle rule?
There is no single market-wide definition. For this article, the phrase refers to a formation using 2 candles, followed by a possible third confirmation bar. TMGM recommends that the next candle close below the paired formation’s lowest low. That is an entry filter, not a deadline or a guaranteed reversal.
Are tweezer bottoms bullish or bearish?
Tweezer bottoms are generally interpreted as bullish reversal candidates after a decline. Their matching lows suggest repeated support, while tops suggest repeated resistance after an advance. A bullish interpretation still requires follow-through and a risk plan. FBS explains both directions; neither direction makes an isolated formation sufficient evidence for a trade.
What are the top 5 bullish candlestick patterns?
A practical study list includes hammer, inverted hammer, bullish engulfing, morning star, and three white soldiers. IG discusses these bullish formations, but the list is not a verified performance ranking. Compare their trend requirements and confirmation methods before testing them. Different definitions can produce different occurrences from the same market history.
Can you trade tweezer tops on crypto?
The same visual geometry can appear there, but equity findings cannot establish reliability in a different market. Trading hours, venue data, liquidity, and costs differ. This guide concerns stocks, ETFs, and related regulated-market workflows; it makes no crypto recommendation. The general formation definition describes appearance rather than asset-specific expected returns.
How long does a tweezer top reversal take?
There is no fixed duration. The next bar may confirm, fail, or remain inside the range. A 4-hour bar and a daily bar represent different waiting periods. TMGM’s next-close confirmation method defines an observation point, not the length of the whole decline. Choose a time-based exit before entering.
Are there verified real trades behind the example?
No. The worked trade is explicitly hypothetical and demonstrates position sizing rather than a realized result. The Reuters levels are reported market context, not proof of historical tweezer occurrences. A verified example would require timestamped bars, adjustment details, execution assumptions, and a documented entry and exit.
Are tweezer top candlestick patterns bullish or bearish?
Bearish. They are potential reversal signals after an uptrend, formed when two candles reject roughly the same high. The signal needs a close below the pair’s lowest low before it means much.
What timeframe works best for tweezer top candlestick patterns?
Daily bars are the practical starting point for swing traders, with 4-hour charts as an option. On 5-minute or 15-minute charts, occurrences multiply and spread and noise matter more.
Do tweezer top candlestick patterns need volume confirmation?
Volume helps but is not required. Expanding activity on the second candle or the confirmation candle strengthens the case when measured against a consistent recent baseline. Tick volume is not the same as exchange volume.
Where do you put a stop on tweezer top candlestick patterns?
Above the shared rejection high, with room for normal fluctuation and costs. Then size the position from that distance: shares equal planned cash risk divided by estimated loss per share.
Conclusion: trade tweezer top candlestick patterns with a process
Tweezer top candlestick patterns earn a place in your process only when the rules come before the chart.
Trade the confirmed rejection only when location and planned risk both make sense. If support is too close, borrow is unavailable, or the stop requires an uncomfortable loss, pass.
Save the setup before the outcome is known. Record the number of qualifying occurrences, preserve failed occurrences, and review the same instructions across a later period. That habit does more for decision quality than collecting extra indicators.
FullStack Alpha’s full stack alpha approach keeps the research, execution, and review connected. Compare AI stock-analysis tools for checking red flags, but write the trade plan before shopping.
References
Each source below covers definitions or market context, not a tested win rate.
These sources support the definitions, educational comparisons, and attributed market context. They do not establish a universal trading success rate.
Tweezer Candlestick Pattern - https://www.tmgm.com/eng/academy/trading-academy/tweezer-candlestick-pattern
Tweezer Top - https://wrtrading.com/technical-analysis/charts/candlestick/pattern/tweezer-top/
16 Candlestick Patterns Every Trader Should Know 180615 - https://www.ig.com/au/trading-strategies/16-candlestick-patterns-every-trader-should-know-180615
Global Markets Technicals Graphic 2026 09 21 - https://www.reuters.com/markets/global-markets-technicals-graphic-2026-09-21/
How To Trade On Tweezer Top And Tweezer Bottom Candlestick Patterns - https://fbs.com/fbs-academy/traders-blog/how-to-trade-on-tweezer-top-and-tweezer-bottom-candlestick-patterns
Compare research tools by task in the FullStack Alpha directory, then choose only what your written process needs.
Affiliate disclosure: FullStack Alpha may earn a commission from qualifying purchases through affiliate links.