52-Week High Stocks This Week: Confirm the Breakout
{"cover":"Professional landscape format (1536x1024) editorial hero image with SHORT bold text overlay reading '52-Week High Stocks This Week' in crisp white bold sans-serif on a deep navy semi-transparent panel, centered on two balanced lines with 10% safe margins from every edge, no character touching any edge. Background: bright daylight studio-lit macro photograph of a modern trading terminal screen showing a clean rising candlestick chart pressing against a horizontal resistance line, muted forest green bullish candles and muted brick-red bearish candles, soft white desk surface, shallow depth of field, premium fintech magazine aesthetic, high contrast, no numbers legible, no price tables, no checkmark grids.","content":["Numbered five-step vertical process flow infographic, landscape 1536x1024, titled visually by five labelled stage cards reading 'Scan For New Highs', 'Check Closing Price', 'Confirm Volume Expansion', 'Compare Relative Strength', 'Check Earnings Date'. Each card has a small flat-vector icon: magnifying glass over a chart, a candle closing above a dashed line, a volume bar spike, two diverging trend lines, a calendar page. Thin connector arrows between cards, soft cream background, navy and plaid-green palette, clean Swiss infographic polish, labels 1-4 words each, fully inside a 5% safe margin.","Side-by-side split-screen labelled comparison diagram, landscape 1536x1024, two large candlestick chart panels. Left panel headed 'Real Breakout' shows a tight consolidation then a strong green candle closing above a dashed resistance line with a tall volume bar beneath, callout labels: 'Closes Above Level', 'Volume Expansion', 'Tight Base'. Right panel headed 'False Breakout' shows a long upper wick poking above the dashed line then closing back inside the range with a thin volume bar, callout labels: 'Long Upper Wick', 'Closes Back Inside', 'Thin Volume'. Dark navy background, muted green and brick-red candles, white thin callout lines, editorial trading-desk guide polish, no numerals.","Annotated documentary-style photograph, landscape 1536x1024, bright natural window light: an overhead angled shot of a wooden desk with a tablet showing a stock chart near a breakout level, a printed earnings calendar page, a paper notebook with a hand-drawn stop-loss diagram, a pen and a coffee cup. Four thin white callout lines with short labels point to objects: 'Breakout Level', 'Earnings Date', 'Stop Placement', 'Position Size'. Warm neutral color grade, shallow depth of field, crisp magazine lifestyle-editorial quality, labels short and non-overlapping inside a 5% safe margin."}
Last updated: October 19, 2026
Quick Answer
For the week ending October 16, Charles Schwab's scan flagged 78 notable 52-week highs and 129 notable 52-week lows at the same time . That split is the whole lesson on 52-week high stocks this week: how to confirm a breakout before you buy matters more than finding the list. A stock printing a new yearly high is a candidate, not a trade. Confirmation means a closing price above the old high, volume meaningfully above the stock's own 50-day average, relative strength versus its sector, and no earnings report landing in the next five sessions.
Key Takeaways
- A 52-week high is the highest price a stock traded in the past year. Hitting it is an alert, not a buy signal.
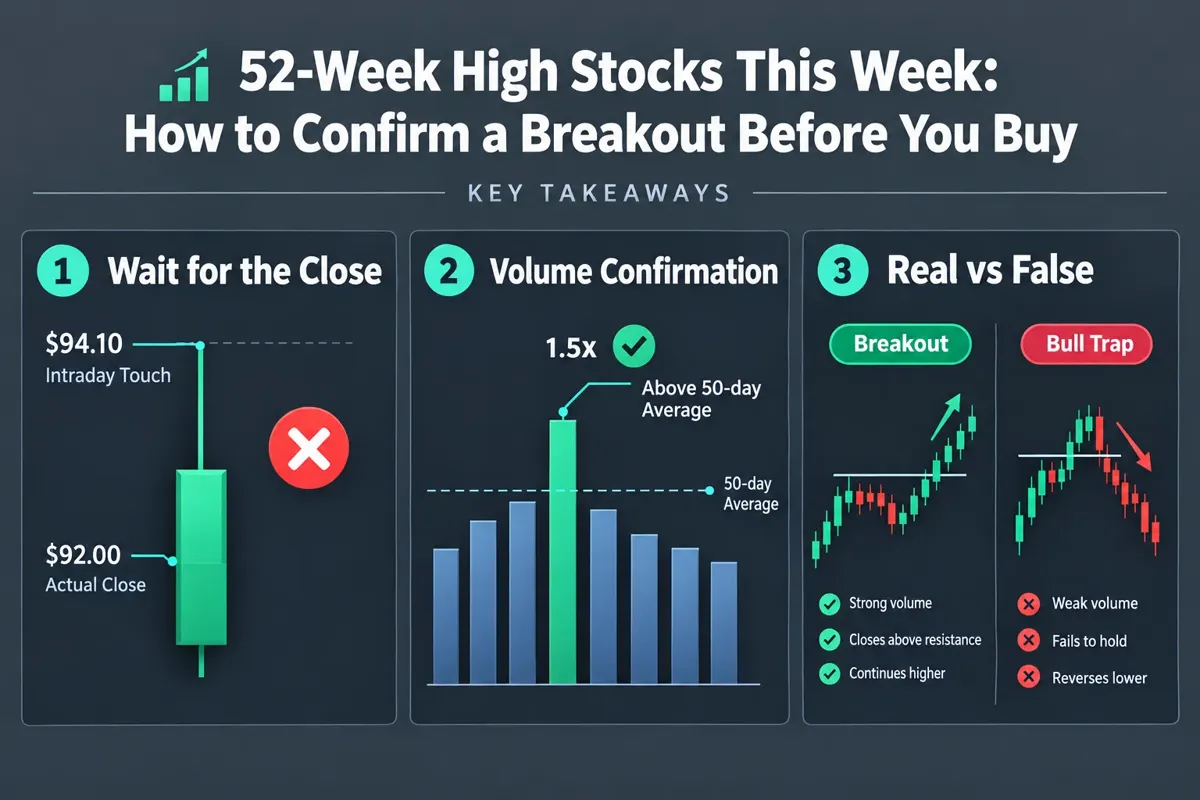
- Wait for a daily close above the prior high, not an intraday print. Coca-Cola touched $94.10 intraday on October 15, 2026, then closed at $92.00 .
- Breakout-day volume should clearly exceed the stock's own 50-day average. Low-volume breakouts lack conviction.
- Broad-index breakouts failed in early October 2026, with major averages reversing back below prior resistance . Stock-specific selection beat index assumption.
- Energy led the 52-week high list that week, with Suncor, BP, Shell, Phillips 66, Petrobras and Exxon all clearing prior peaks .
- Breakouts into a binary event (Phase 3 data, an earnings print) carry gap risk that a stop loss cannot protect you from.
- Beginners should wait a day for confirmation. Experienced traders can buy the breakout bar if their stop and size are pre-defined.
- No stop, no size, no plan: play stupid games.
What does a 52-week high mean in stock trading?
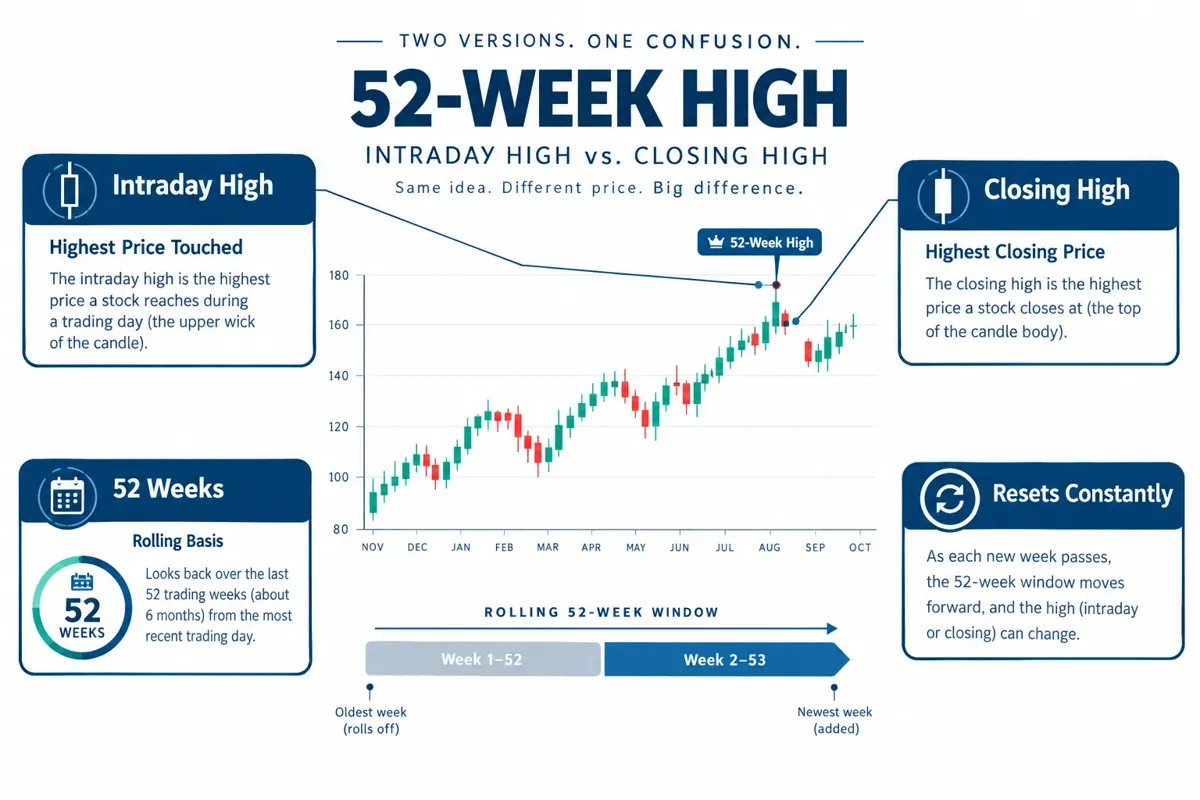
A 52-week high is the highest price a stock has traded at during the previous 52 weeks, measured on a rolling basis. It resets constantly, which is why the list changes every single week .
Two versions exist and traders confuse them constantly:
- Intraday 52-week high, the highest price touched at any moment, including wicks and one-second spikes.
- Closing 52-week high, the highest daily close. Stricter, and the one that matters for confirmation.
Why traders care: at a new 52-week high, almost nobody who owns the stock is sitting on a loss. That removes the overhead supply of trapped holders who sell at breakeven. Less resistance above, more room for price discovery.
Decision rule: if you're comparing a stock's current price to its yearly high, use closing data from the same exchange and the same timestamp. Moderna's move that week was reported around $218.01 in one weekly screen and as high as $242.29 in another report , because intraday and subsequent pricing differ by source. Verify before you act.
How do you find stocks hitting 52-week highs this week?
Use a free screener with a "new 52-week high" filter, then layer your own conditions on top. The raw list is noise. Your filters turn it into a watchlist.
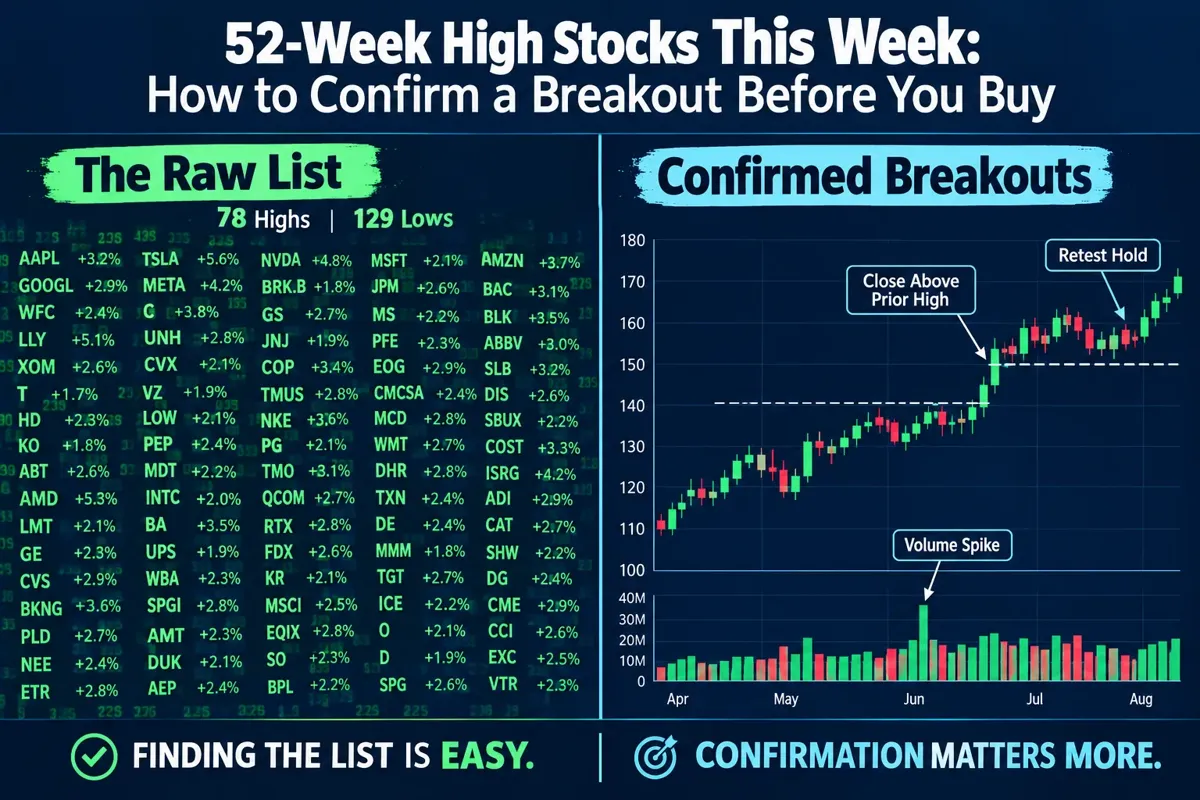
Where the lists actually come from:
| Source type | What it gives you | What it misses |
|---|---|---|
| Free screeners (Finviz, exchange data) | Raw daily lists of new highs | Volume context, sector weighting |
| Weekly broker research | Breadth context, highs vs lows | Real-time entries |
| Financial media screens | Named movers and percentage above prior high | Timestamp precision |
| AI-ranked screeners | Pre-filtered, factor-scored candidates | Black-box logic if the method isn't published |
A practical weekly workflow:
- Pull the new-highs list Friday after the close, not Monday morning.
- Cut anything under $5 and under 500,000 average daily shares. Thin names fake you out.
- Cut anything that reports earnings inside the next week.
- Rank the survivors by volume expansion versus the 50-day average.
- Keep the top eight. That's your watchlist.
If you want the screening step done faster, our breakdown of the best free AI stock screeners covers which ones surface new highs without a subscription, and the Stock Rover vs Finviz screener comparison shows where each one actually earns its fee.
Is buying stocks at 52-week highs a good strategy?
It can be, but only with confirmation rules attached. Buying new highs is a momentum approach. It works when the trend is intact and breaks badly when the broad tape turns choppy.
Look at what happened in early October 2026. The S&P 500 briefly reached roughly 7,845 on October 6, clearing its August peak near 7,817, then finished the following week around 7,659, back below the old resistance . The Nasdaq Composite lost about 4.5% that week and reversed its own breakout . Anyone who bought the first print above resistance was underwater within days.
Schwab's same-week scan showed breadth improving in the S&P 500 but deteriorating in the Russell 2000 and the Nasdaq Composite . Translation: fewer stocks were carrying more of the index. That's a market where individual selection matters and blanket momentum buying gets punished.
Choose this strategy if: you have a defined stop loss, you size positions so a single loss costs under 1% of your account, and you can sit out weeks when the tape is choppy.
Skip it if: you buy because the ticker is green and sell because it's red.
How to confirm a breakout before you buy
Confirmation is a checklist, not a feeling. Four conditions, and a candidate needs at least three.
1. Closing price above the prior high
Investopedia's breakout guidance is blunt: wait for a trading-period close above resistance, because a stock can open above the level and finish back inside the prior range. That's a textbook false breakout.
Coca-Cola is the live example. It hit an intraday 52-week high of $94.10 on October 15, 2026, then closed at $92.00 . The intraday print looked like a breakout. The close said the buyers ran out of gas. Swing traders can tighten this further by requiring two consecutive closes above the level.
2. Volume expansion versus the stock's own average
Charles Schwab's guidance is that breakouts are more significant on high or above-average volume, and that low-volume breakouts may lack conviction. The comparison that matters is the stock against itself, not against the market.
3. Relative strength versus sector and index
If a stock is making a new high while its sector is flat and the index is falling, the buying is specific to that name. That's a cleaner setup than a stock floating up with everything else.
4. Catalyst quality
Was there a reason? Visa reached a record high after BMO Capital Markets raised its target from $405 to $425 with an Outperform rating, citing consumer spending and value-added services growth . Coca-Cola's move came alongside reports that KFC's U.S. restaurants were switching beverage suppliers to Coke . Those are concrete, already-happened catalysts. An analyst target change is weaker fuel than a signed commercial deal, and neither guarantees anything.
Common mistake: treating an analyst price target as confirmation. Targets lag expectations and get revised after the move, not before it.
What technical indicators confirm a real breakout versus a false breakout?
The four most reliable confirmations are a strong daily close above the level, volume at least 1.5 times the 50-day average, a tight consolidation (basing) before the move, and price holding above the breakout level on the retest.
| Signal | Real breakout | False breakout (bull trap) |
|---|---|---|
| Daily close | Closes in the upper third of the day's range, above resistance | Long upper wick, closes back inside the prior range |
| Volume | Clear expansion over the 50-day average | Flat or below average |
| Prior structure | Tight consolidation, narrowing range, low volatility | Vertical run with no base |
| Follow-through | Holds above the level for 2-3 sessions | Back under the level within one or two days |
| Sector behavior | Peers also strong | Isolated spike |
Bull trap means price pops above a level, pulls in buyers, then reverses and traps them. It's the single most expensive pattern for new breakout traders, and it almost always shows the same tell: a long upper wick on thin volume.
Edge case: a gap-up breakout on earnings with huge volume can be real even without a base. The trade-off is you have no clean stop level, so size down hard.
52-week high stocks that actually have momentum
Momentum shows up as sector-wide participation, not a lone ticker. The week reported October 16, 2026 is a clean illustration.
Energy carried the list. Suncor, BP, Shell, Phillips 66, Petrobras and Exxon Mobil all exceeded prior yearly peaks . Suncor cleared its previous high by roughly 8.6% . When six large names in one sector print new highs in the same week, that's capital rotating into a theme, not one company getting lucky.
Schwab's own list of notable highs that week included AbbVie, Chevron, Mastercard, Pfizer, Suncor Energy and Valero . Healthcare, energy, payments. Three different themes, which again argues for stock-by-stock selection.
The trade-off with sector momentum: group strength is better evidence, but it also means every position in that group reacts to the same headline. Six energy names is one oil-price bet wearing six costumes. Size accordingly.
Why do some stocks fail after hitting 52-week highs?
Most failures trace to one of four causes: the move was driven by an event that hasn't happened yet, volume never confirmed it, the broad market turned, or the stock was already overextended before the breakout.
Moderna is the example of the first. It ran to a new high partly on anticipation: Goldman Sachs analyst Salveen Richter raised the price target from $120 to $137 while keeping a Neutral rating, and investors were waiting on Phase 3 melanoma-vaccine data expected at the European Society for Medical Oncology Congress on October 24, 2026 . A breakout running into a binary clinical readout isn't a momentum trade. It's a coin flip with a chart attached.
Other failure modes worth naming:
- Overextended entry. The stock is 20% above its 50-day moving average when it breaks out. There's no low-risk stop level anywhere nearby.
- Market reversal. Early October 2026 showed record breakouts unraveling as investors dumped recent winners . Your stock can be fine and still get sold.
- Thin float with no institutional buying. Price moves on small volume and gives it all back.
- Short-covering spike. A reported SEC proposal would require institutional asset managers to file monthly short-sale data under Exchange Act Rule 13f-2, with aggregated security-level data published by the SEC, plus a Regulation SHO proposal to mark "buy-to-cover" orders . Short interest amplifies moves in both directions, and a squeeze-driven high often round-trips.
When is the best time to buy after a stock hits a 52-week high?
Three entries work, ranked by risk. Pick one and use it consistently rather than improvising per trade.
- The confirmed close (lowest risk for most traders). Buy the next morning after a strong close above the prior high on expanded volume. You give up some price for a lot less guesswork.
- The breakout bar (highest risk, best price). Buy intraday as price clears the level on heavy volume. You need a pre-set stop under the breakout level and real-time volume comparison. Experienced traders only.
- The retest (cleanest risk-reward). Wait for price to pull back to the old high and hold it. The former resistance becomes support. You often miss the fastest movers entirely, and that's the cost.
Avoid entirely: buying day three of a vertical run. Approximately 214 companies with market caps above $2 billion were scheduled to report between October 19 and October 23, 2026, including Meta, Tesla, Netflix and Procter & Gamble . A breakout entered the day before earnings can gap straight through your stop overnight. Your stop loss is an order, not a force field.
How much volume do you need to confirm a breakout?
Compare breakout-day volume to the stock's own 50-day average volume. A practical working threshold is at least 1.5 times average, and 2x or more on a genuine institutional entry. Schwab's framing is that breakouts carry more weight on above-average volume, while low-volume breakouts may lack conviction.
What volume is telling you, in plain English: price is an opinion, volume is the number of people with money behind it. A 3% move on half-average volume is a few traders. The same move on triple volume is funds building positions.
Quick volume check:
- Pull up 50-day average volume (every screener shows it).
- Compare to today's volume, adjusted for time of day if you're checking intraday.
- Under 1.0x average: ignore the breakout entirely.
- 1.0x to 1.5x: watchlist only, no entry.
- Above 1.5x with a strong close: tradeable candidate.
Edge case: a low-float stock can trade 5x average volume on a tiny dollar amount. Check dollar volume (price times shares) too, or you'll mistake a few retail orders for institutional accumulation.
What are the common mistakes when trading 52-week high breakouts?
The most expensive errors are entering on an intraday print, ignoring the earnings calendar, sizing too large because the chart "looks obvious," and chasing after the move is already extended.
The repeat offenders:
- Buying the wick. You saw the intraday high, you bought, it closed back in the range. Coca-Cola's $94.10 intraday versus $92.00 close is the pattern in one line .
- Trading through an event. Moderna's run into October 24 data is the clearest version. Catalyst risk cuts both ways .
- No stop before entry. If you can't say where you're wrong before you click buy, you don't have a trade, you have a hope.
- Oversizing. The cleanest-looking setup on your screen should still only risk a fixed small percentage of the account.
- Revenge trading the failed breakout. It stopped you out, you bought it back higher, it stopped you out again.
- Ignoring breadth. 78 new highs against 129 new lows in the same week is not a market handing out free money .
Before any of this is worth doing, you need to know what your actual advantage is. Our guide on how to find a trading edge before risking real money walks through defining one in a single sentence.
52-week high stocks for beginners versus experienced traders
Beginners should trade confirmed closes on large, liquid stocks with a fixed stop. Experienced traders can take intraday breakouts, use partial positions, and add on a retest. The difference is entry timing and position management, not stock selection.
| Factor | Beginner approach | Experienced approach |
|---|---|---|
| Entry | Next-day open after a confirmed close | Intraday on the breakout bar |
| Stocks | Large cap, over 1M average shares | Any liquid name, including mid-caps |
| Position | One entry, full planned size | Starter position, add on strength |
| Stop | Hard stop under the breakout level | Mental or structural stop, wider band |
| Earnings | Avoid entirely within 5 sessions | May trade post-earnings gaps |
| Risk per trade | Under 0.5% of account | 0.5% to 1% |
Should you buy dips or breakouts on 52-week high stocks? Breakouts if you want speed and can tolerate more false starts. Dips (specifically, the retest of the old high) if you want better risk-reward and can accept missing the strongest movers. Doing both in the same stock usually means you're averaging down into a failure and calling it a strategy. Pick one per trade, write it down, and judge the method over 30 trades, not three.
How long do 52-week high breakouts usually last?
There's no fixed duration, and anyone quoting you a precise average is selling something. What's observable is that breakouts either confirm or fail fast. Most false breakouts show their hand within one to three sessions by closing back under the breakout level.
A workable management rule:
- Days 1-3: the test window. Hold above the level or exit. No negotiation.
- Week 1-2: if it holds and volume stays healthy, move the stop to breakeven.
- Beyond that: trail the stop under rising support. The trend is your friend until it isn't.
Early October 2026 compressed the whole cycle into days. Record breakouts unraveled as investors sold recent winners, and the Nasdaq Composite dropped roughly 4.5% in a week . Confirmation is a filter, not insurance. Even confirmed breakouts fail when the tape turns.
FAQ
What is a 52-week high?
The highest price a stock has traded during the past 52 weeks, measured on a rolling basis. Some data sources report intraday highs, others report closing highs, so always check which one you're looking at .
Does hitting a 52-week high mean a stock is overvalued?
No. A 52-week high is a price measurement, not a valuation measurement. A stock can hit a new high and still trade at a reasonable multiple if earnings grew faster than the price.
How many stocks hit 52-week highs in a typical week?
It varies widely with market conditions. Charles Schwab reported 78 notable 52-week highs and 129 notable 52-week lows for the week ending October 16, 2026 .
Which sectors led 52-week highs in mid-October 2026?
Energy dominated. Suncor, BP, Shell, Phillips 66, Petrobras and Exxon Mobil all cleared prior yearly peaks, with Suncor roughly 8.6% above its previous high .
Should I buy a stock the day it hits a 52-week high?
Only if it closes above the prior high on above-average volume and has no earnings report in the next few sessions. Intraday prints reverse often.
What volume confirms a breakout?
Compare the breakout day to the stock's own 50-day average volume. Above 1.5x is a reasonable working threshold; below average volume suggests weak conviction.
What is a bull trap?
Price breaks above a key level, pulls in buyers, then reverses back below it and traps them. The usual tell is a long upper wick with thin volume.
Can a stock break out right before earnings?
Yes, and it's one of the riskiest setups available. A gap through your stop overnight means your actual loss can exceed your planned loss. With about 214 companies above $2 billion in market cap reporting between October 19 and 23, 2026, that risk was elevated .
Are analyst price target raises a breakout confirmation?
No. They're context. BMO raised Visa's target from $405 to $425 with an Outperform rating , and Goldman raised Moderna's from $120 to $137 while keeping a Neutral rating . Targets get revised after moves as often as before them.
Where should I place a stop on a breakout trade?
Most traders use a level just under the breakout point or under the low of the breakout bar. The stop defines your risk, so set it before entry and size the position around it.
Conclusion: Your weekly breakout routine
Finding 52-week high stocks takes thirty seconds with a free screener. Confirming them takes a process, and that's the part almost nobody does.
Run this every Friday after the close:
- Pull the new-highs list. Cut anything under $5 or under 500,000 average shares.
- Check the close, not the wick. Did it finish above the prior 52-week high? If not, delete it.
- Check volume against its own 50-day average. Under 1.5x goes on the watchlist, not in the account.
- Check the sector. Are peers also strong, or is this one ticker floating alone?
- Check the earnings calendar. Reporting in the next five sessions? Skip it.
- Write your stop and your size before you place the order. Both numbers, on paper, before entry.
- Give it three sessions to prove itself. Back under the level, you're out.
Eight candidates become two real trades most weeks. That's the system working, not failing. Paper trade it for 30 days before you commit real money, and let the results argue back.
Fewer tabs, fewer alerts, one checklist you actually run. Cut the noise, keep the alpha.
Related reading: AI stock screeners and how they rank setups · What to check before downloading an AI trading app · Stock market terms: 200+ definitions A-Z
One topic, broken down. There are 200+ AI stock tools catalogued in the FullStack Alpha directory, filterable by category, price and what they actually do.
Browse the directory → aistockpickerapps.com
References
Weekly Traders Outlook - https://www.schwab.com/learn/story/weekly-traders-outlook
54 Stocks Printed Fresh 52 Week Highs This Week And Big Oil Mrna Price Extreme - https://247wallst.com/cards/54-stocks-printed-fresh-52-week-highs-this-week-and-big-oil-mrna-price-extreme-01m552z140fbx6me41fv2y94c3
36 Stocks Set Fresh 52 Week Highs This Week With Petrobras Pbr Price Extreme - https://247wallst.com/cards/36-stocks-set-fresh-52-week-highs-this-week-with-petrobras-pbr-price-extreme-01m4k2583hvqm8t4r4vxc3sgc6
Price Northwestern Nasdaq Nwe Sets New 52 Week High Heres What Happened - https://www.marketbeat.com/instant-alerts/price-northwestern-nasdaq-nwe-sets-new-52-week-high-heres-what-happened-2026-10-15/
Wall Streets Record Breakouts Unravel As Investors Dump Recent Winners Chart Of The Day - https://finance.yahoo.com/markets/article/wall-streets-record-breakouts-unravel-as-investors-dump-recent-winners-chart-of-the-day-115226004.html
Price Cocacola Nyse Ko Hits New 52 Week High Should You Buy - https://www.marketbeat.com/instant-alerts/price-cocacola-nyse-ko-hits-new-52-week-high-should-you-buy-2026-10-15/
Price Ltc Properties Nyse Ltc Hits New 52 Week High Time To Buy - https://www.marketbeat.com/instant-alerts/price-ltc-properties-nyse-ltc-hits-new-52-week-high-time-to-buy-2026-10-15/
106 75 66 Our Ai Just Called These Energy Breakouts - https://www.investing.com/news/stock-market-news/106-75-66-our-ai-just-called-these-energy-breakouts-4945336
52 Week High - https://www.investing.com/equities/52-week-high