Stock Market Movers This Week: Volume, News, RSI

Last updated: November 2, 2026
Quick Answer
Reading stock market movers this week comes down to three filters: volume (is anyone actually trading it?), news (is the catalyst durable or a one-day headline?), and relative strength (is it beating the index, or just moving with it?). A mover with heavy volume, a guidance-level catalyst, and better performance than the S&P 500 is a candidate. A mover with thin volume and a rumor is noise. The workflow below separates the two in about fifteen minutes a day.
Key Takeaways
- Volume is participation, not price. It tells you how many shares changed hands, which tells you how much conviction sits behind a move.
- A big move on light volume is fragile. Intel falling nearly 30% on heavy volume after guiding for no positive 2026 cash flow is repositioning, not a blip.
- News quality beats news volume. Guidance, cash flow, and margins move stocks longer than a headline beat.
- Relative strength compares a stock to a benchmark. RSI (Relative Strength Index) compares a stock to itself. Two different tools, constantly confused.
- October 2026 was a breadth lesson: the S&P 500 fell about 0.9% while 72% of its members rose .
- Chasing an already-overextended mover at the open is where most small accounts bleed.
- Beginners should paper trade movers for 30 sessions before risking size.
- One process, run weekly, beats six scanners run randomly.
What does volume mean in stock trading?
Volume is the number of shares traded in a given period. It measures participation. Price tells you where, volume tells you how many people agreed to go there.
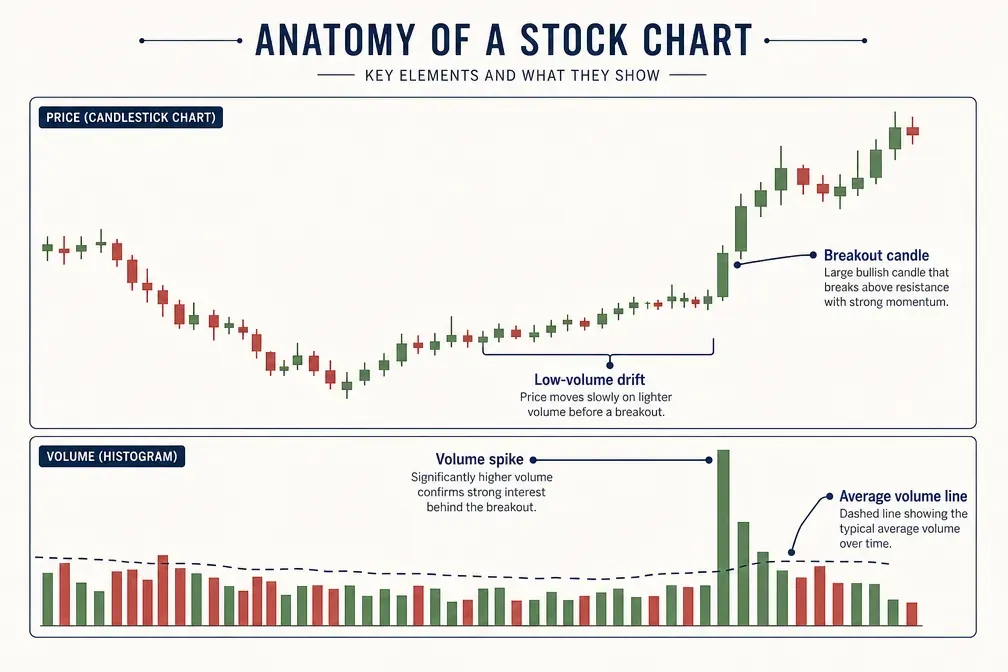
Think of it like a restaurant. A sign saying "best tacos in town" is price. A line out the door at 7pm is volume. One is a claim, the other is evidence.
What to actually look at:
- Relative volume (RVOL): today's volume divided by the stock's average for the same time of day. RVOL of 3 means three times normal participation.
- Average daily volume: the 20-day or 50-day baseline. Under 300,000 shares a day, spreads get wide and your exit gets expensive.
- Volume on the breakout bar: the move through resistance (a price level that has rejected the stock before) should come with a volume surge, not a whisper.
Decision rule: if a stock is up 8% on 0.9x average volume, treat it as unconfirmed. You're watching, not buying.
Why is high volume important when a stock is rising?
High volume on a rising stock means institutions are likely involved, and institutions can't exit in one click. That makes the move more likely to persist than a thin-tape pop.
Funds move in blocks. When a $40 billion manager rebuilds a position, it shows up as days of elevated volume, not one spike. That's why heavy-volume advances tend to get bought on pullbacks: there are buyers underneath with a cost basis to defend.
The inverse is the trap. Low-volume rallies have nobody underneath. First piece of bad news, the bid vanishes, and you're staring at a bull trap (a breakout that fails and reverses straight back down).
Can a stock move significantly on low volume?
Yes, and that's exactly why volume matters. Low float stocks (companies with few shares available to trade) can jump 20% on volume that wouldn't move a large-cap half a percent.
Low-volume moves are common in three places:
- Low float small caps, where a modest order overwhelms the order book.
- After-hours and pre-market, where liquidity is a fraction of regular hours.
- Holiday and summer sessions, when the tape is choppy and thin.
Edge case: a quiet, low-volume drift upward inside a tight consolidation (a narrow price range) isn't bearish. That's basing. What you don't want is a low-volume vertical spike. One is coiling, the other is a firework.
How do you spot stocks moving up this week?
Start with a gainers list, then immediately strip out everything that fails a volume and catalyst test. Most "top movers" lists are a graveyard of low float spikes and dead cat bounces.
A workable weekly scan:
| Filter | Setting | Why |
|---|---|---|
| Price | Above $5 | Avoids the worst liquidity and spread problems |
| Average volume | Above 500,000 shares | You can get out |
| Relative volume | Above 2.0 | Something changed today |
| Weekly change | Above the index's weekly change | Relative strength, not drift |
| Catalyst | Identifiable and dated | You know what you're trading |
Run the same screen every weekend. If you want help picking a screener that handles this, the Stock Rover vs Finviz screener comparison covers which one earns its subscription.
How do you find movers before they spike?
You don't find them before they move. You build a watchlist of stocks already set up to move, then wait for volume to confirm. Prediction is a loser's game; preparation isn't.
Pre-positioning sources that genuinely work:
- The earnings calendar. Apple reported fiscal Q4 on November 2, 2026, with analysts expecting roughly $113 billion in revenue and about 11% year-over-year growth . AMD was also due that week . Those dates were public weeks out.
- Macro dates. The FOMC statement landed October 28, 2026, with minutes scheduled for November 18 .
- Tight consolidations. Stocks compressing into a narrow range near highs are the ones that gap.
- Pre-market futures and overnight action. The pre-market signals that actually predict the open are worth more than a gut feel at 9:28am.
Common mistake: confusing a watchlist with a buy list. The watchlist is a queue. Volume is the gatekeeper.
What kind of news actually triggers stock price movement?
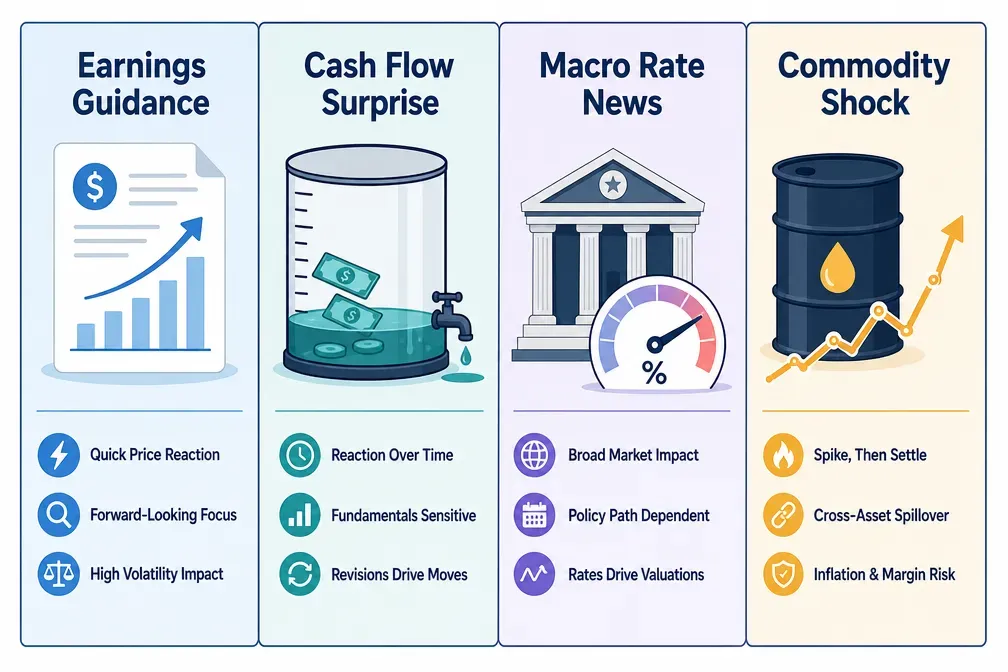
Forward guidance, cash flow, and margins move stocks. Backward-looking revenue beats mostly don't, because they're already priced in.
Rank your catalysts:
- Tier 1, durable: guidance cuts or raises, cash flow deterioration, margin compression, product cycle shifts. Intel's near-30% drop followed a weak revenue forecast plus a statement that it didn't expect positive 2026 cash flow . Amazon's reaction came from capital spending of roughly $94.8 billion over twelve months against free cash flow of negative $42.4 billion . Those aren't one-day stories.
- Tier 2, situational: macro prints, rate expectations, commodity shocks. Brent crude above $116 in late October pressures transport and consumer names while lifting energy.
- Tier 3, noise: analyst reiterations, conference chatter, "sources say" posts.
Decision rule: if you can't name the catalyst tier in one sentence, you don't understand the trade yet.
How to read news sentiment for stock price changes
Read the market's reaction, not the headline's tone. A stock that opens red on good news is telling you expectations were higher than the print.
Three checks that take 90 seconds:
- Gap direction versus headline tone. Disagreement is the signal.
- Volume behind the gap. Heavy volume reversals matter; light ones usually gap fill.
- Sector confirmation. If one semiconductor name sells off and the rest hold, it's company-specific. If the whole group goes, it's the AI capex trade repricing.
Goldman's Ben Snider framed the backdrop well, writing that earnings growth was strong but "no longer accelerating" even as AI investment kept growing . That's a deceleration story, not a collapse, and it explains why guidance mattered more than beats this quarter.
AI news tools can speed this up, though many are a public language model with a dashboard. The AI stock analysis tools that catch red flags breakdown separates them.
What's the difference between relative strength and momentum?
Relative strength measures a stock against a benchmark. Momentum measures the speed and size of a stock's own move. A stock can have strong momentum and weak relative strength if the whole market is running faster.
October 2026 made this concrete. The S&P 500 fell about 0.9% for the month, yet 72% of its members rose , and the equal-weight version of the index gained roughly 5% . Mega-cap tech dragged the headline number down while the median stock did fine. Momentum said "market's down." Relative strength said "most things are up, just not the biggest things."
Practical takeaway: rank your watchlist by weekly performance versus SPY. Trade the top of that list, not whatever gapped hardest this morning.
What is the Relative Strength Index and how do you use it?
RSI (Relative Strength Index) is a 0 to 100 oscillator measuring the magnitude of recent gains against recent losses, usually over 14 periods. Above 70 is conventionally "overbought," below 30 "oversold." Despite the name, it compares a stock to its own history, not to the market.
Using RSI to confirm a mover is real:
- RSI breaking above 60 on a breakout supports the move. Weak breakouts often stall in the 50s.
- RSI above 80 after a multi-day run means overextended. Not a short signal, a don't-chase signal.
- Divergence (price makes a new high, RSI doesn't) warns that participation is fading. Pair that with declining volume and you likely have a failing move.
Common mistake: selling purely because RSI hit 70. In a strong uptrend, RSI can sit above 70 for weeks. The trend is your friend until volume says otherwise.
Best time to buy into a stock that's already moving
The lower-risk entry is usually the first orderly pullback after the volume spike, not the opening print. Buying the first five minutes of a gap is where small accounts donate.
Three common entries, ranked by risk:
| Entry | Risk | When it works |
|---|---|---|
| Opening gap chase | Highest | Rarely. Spreads are wide, stops get hunted |
| First pullback to support | Moderate | After a heavy-volume breakout that holds |
| Consolidation breakout days later | Lowest | Stock digests the news in a tight range, then resumes |
Position sizing matters more than entry timing. Define your stop first (the price that proves you wrong), then size so a loss costs a fixed, small percentage of the account. No stop, no trade.
Can you actually make money trading stock movers, and should beginners try?
Some traders do, most don't, and beginners should paper trade it first. Trading movers is a high-variance style that punishes undisciplined position sizing faster than any other approach.
Trade movers if you can watch the open, you've written entry and exit rules, and you can sit out a day with no clean setup. Pick a slower approach if you're employed during market hours or you've been revenge trading after losses.
A saner starting point for most people: swing trading, which gives you days instead of seconds to be right. The guide on how to find stocks for swing trading early is a better first stop than a momentum scanner. And if AI tools are part of the plan, AI stock tools for beginners will save you three months of trial subscriptions.
What mistakes do traders make with volume analysis?
The biggest one is reading raw volume instead of relative volume. Ten million shares is huge for one stock and a slow Tuesday for another.
The recurring errors:
- Ignoring time of day. Volume front-loads at the open. A 10am RVOL reading is not a full-day reading.
- Treating any spike as bullish. Heavy volume on a down day is distribution, meaning institutions selling.
- Forgetting index rebalances and options expiration. Those create volume with no fundamental story behind them.
- Missing the volume fade. A move that started on 5x volume and is now running on 1.1x is running on fumes.
- Trading illiquid names with large size. Your own order becomes the volume. Play stupid games.
Earnings season compounds all of this. Reported-quarter numbers and forward guidance are two separate trades, and the second one usually wins.
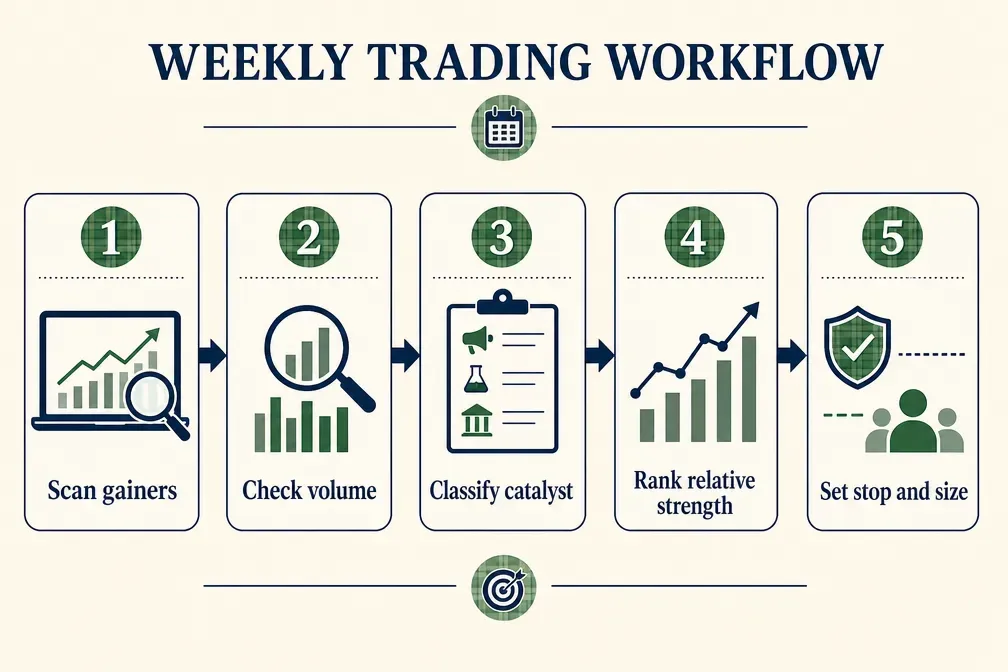
The weekly workflow, in five steps
- Sunday: list the week's earnings and macro dates. The early-November 2026 calendar stacked Apple, AMD, Uber on the 4th, Airbnb on the 5th, and the jobs report . Clustered catalysts mean more gaps.
- Pre-market: scan gainers and losers, note relative volume, discard anything under your liquidity floor.
- First 30 minutes: watch, don't trade. Let the opening auction noise clear.
- Mid-day: rank survivors by relative strength versus the index, write down entry, stop, and size for the top three.
- Friday: review every trade against your rules, not against the outcome. A profitable rule-break is still a rule-break.
Fifteen minutes a day. Boring and repeatable beats clever.
Conclusion
Volume tells you who showed up. News tells you why. Relative strength tells you whether it's worth your capital versus just owning the index. Run all three in order and most of this week's movers eliminate themselves before you risk a dollar.
Your next step: build one screen with a $5 price floor, 500,000 average volume, and 2.0 relative volume. Paper trade the output for 30 sessions. Log the catalyst tier and the RSI reading on every entry. Then look at what your own data says about which setups you should actually be taking. Process over prediction.
Cut the noise, keep the alpha.
Depth here, breadth there. There are 200+ AI stock tools catalogued in the FullStack Alpha directory, filterable by category, price and what they actually do.
Browse the directory → aistockpickerapps.com
FAQ
Is volume a leading or lagging indicator?
Volume is confirming, not predictive. It validates a price move that already started, which is why it belongs in your entry checklist rather than your scan trigger.
What relative volume number signals a real mover?
Most active traders treat 2.0x average volume as the minimum and 5x or more as a genuine event. Below 1.5x, the move usually lacks institutional participation.
Does RSI work on weekly charts?
Yes. Weekly RSI smooths out daily noise and suits swing traders better. Daily RSI is more useful for timing entries within an existing trend.
Why did the S&P 500 fall in October 2026 if most stocks rose?
The index is capitalization-weighted, so its largest technology holdings dominate the result. The S&P 500 fell about 0.9% while 72% of its constituents rose, and the equal-weight version gained roughly 5% .
Should I trade a stock that gapped up 20% overnight?
Usually not at the open. Wait for the first pullback to hold support on declining selling volume, or skip it. Gap chasing without a stop is the most reliable way to lose money quickly.
What's the difference between distribution and accumulation volume?
Accumulation is heavy volume on up days with closes near the high. Distribution is heavy volume on down days with closes near the low. Both indicate institutional activity, in opposite directions.
How many movers should I track at once?
Three to five. Beyond that, most traders hit analysis paralysis and end up acting on whichever one moved last rather than whichever one fit their rules.
Do news sentiment tools replace reading the filing?
No. They flag what to read faster. Cash flow, capital expenditure, and guidance language still need human eyes, which is why checking primary filings on SEC EDGAR remains part of the job.
Is low-volume drifting upward a bad sign?
Not necessarily. Quiet upward drift inside a tight range is basing. A low-volume vertical spike is the warning sign, not slow consolidation.
What stops out most momentum traders?
Position size, not stop placement. Sizing so one loss costs more than 1 to 2% of the account turns a normal losing streak into an account-ending one.
References
- The Stock Market's Front Runners Stumbled In October, Here's Where The Smart Money Is Moving Now. morningstar.com.
- Stocks Started the Week with Promise but Ended in Despair. cnbc.com.
- Weekend Update October 26th 2026. oakharvestfg.com.
- Weekly Market Movers October 26 2026. wealthenhancement.com.
- Articles. schwabnetwork.com.