Pre Market Futures Today: 5 Signals That Predict the Open
Last updated: September 1, 2026
Most traders check pre market futures today at 5 a.m., see green, and mentally spend the money before their coffee cools. Then the 8:30 a.m. ET data print lands, pre market futures today flip red, and the 9:30 open makes them look like they'd been reading a horoscope.
Quick Answer
Pre-market index futures (E-mini S&P 500, Nasdaq-100, Dow, Russell 2000) trade nearly 24 hours on CME Globex and give a real but unreliable read on the cash open. Overnight moves happen on thin volume and get repriced by the 8:30 a.m. ET economic release, so the 8:30 to 9:15 a.m. ET window is the only futures read worth building a plan around. Free real-time or lightly delayed quotes are available from CNBC, Investing.com, CNN, Yahoo Finance, TradingView's free tier and CME Group itself, with no paid data feed required.
Key Takeaways
- Futures at 4 a.m. are noise. Futures at 8:45 a.m. are information. The gap between those two readings is where most bad pre-market decisions live.
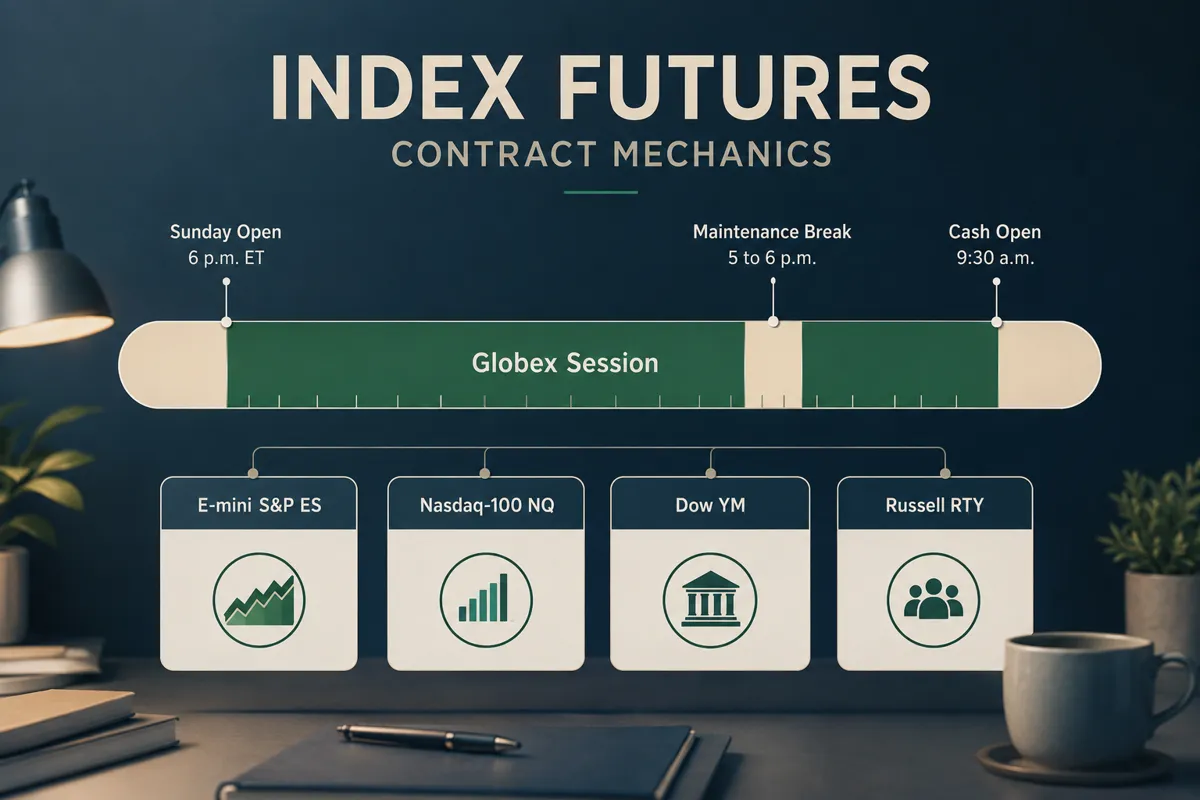
- E-mini S&P 500 (ES), Nasdaq-100 (NQ), Dow (YM) and Russell 2000 (RTY) trade on CME Globex from Sunday 6:00 p.m. ET to Friday 5:00 p.m. ET, with a daily maintenance pause from 5:00 to 6:00 p.m. ET.
- Futures track fair value against the cash index, not the index itself, so a futures print is never a clean one-to-one forecast of the S&P 500's opening tick.
- Equity pre-market sessions run roughly 4:00 a.m. to 9:30 a.m. ET at most retail brokers, with wide spreads and thin order books.
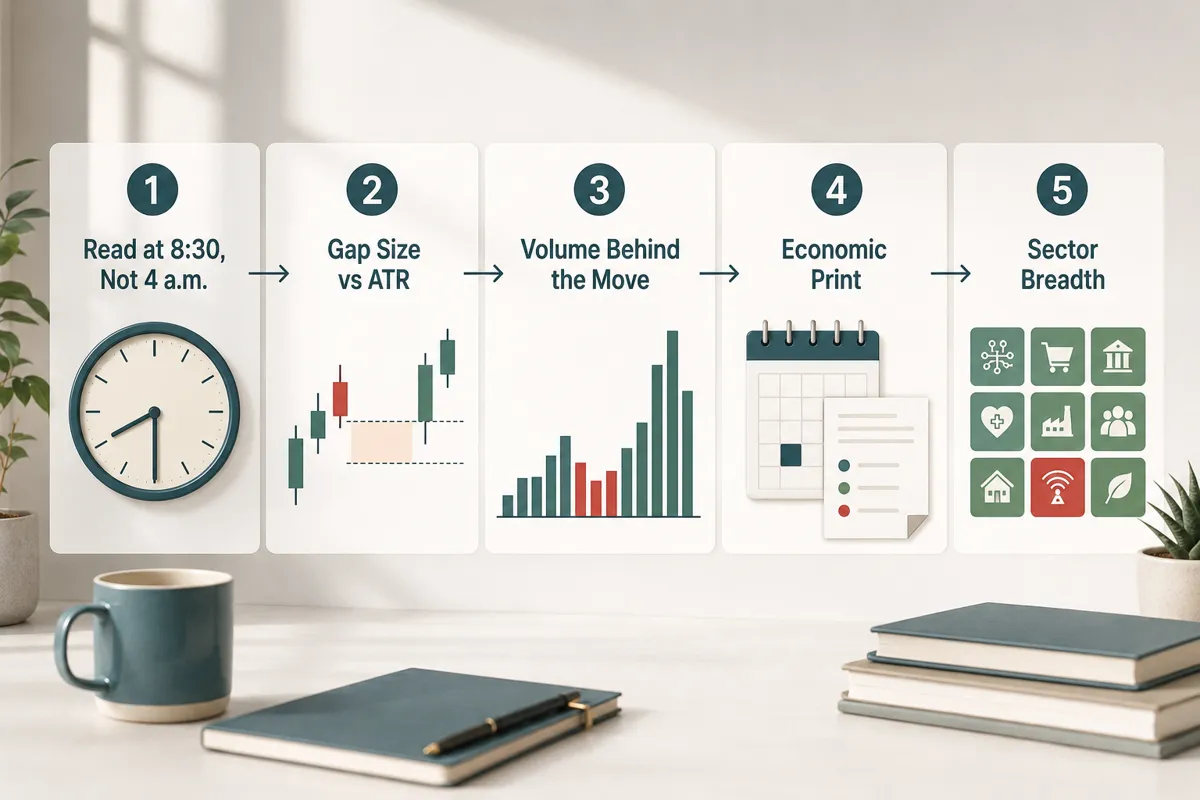
- The five signals that matter: the 8:30 a.m. level, gap size versus average true range, pre-market volume, the economic print, and sector breadth versus a single-name catalyst.
- Dispersion is the real tell. On August 31, 2026, index futures were modestly lower while individual names ran in both directions, with NVIDIA up 0.62% and Edison International down 19.72% in pre-market.
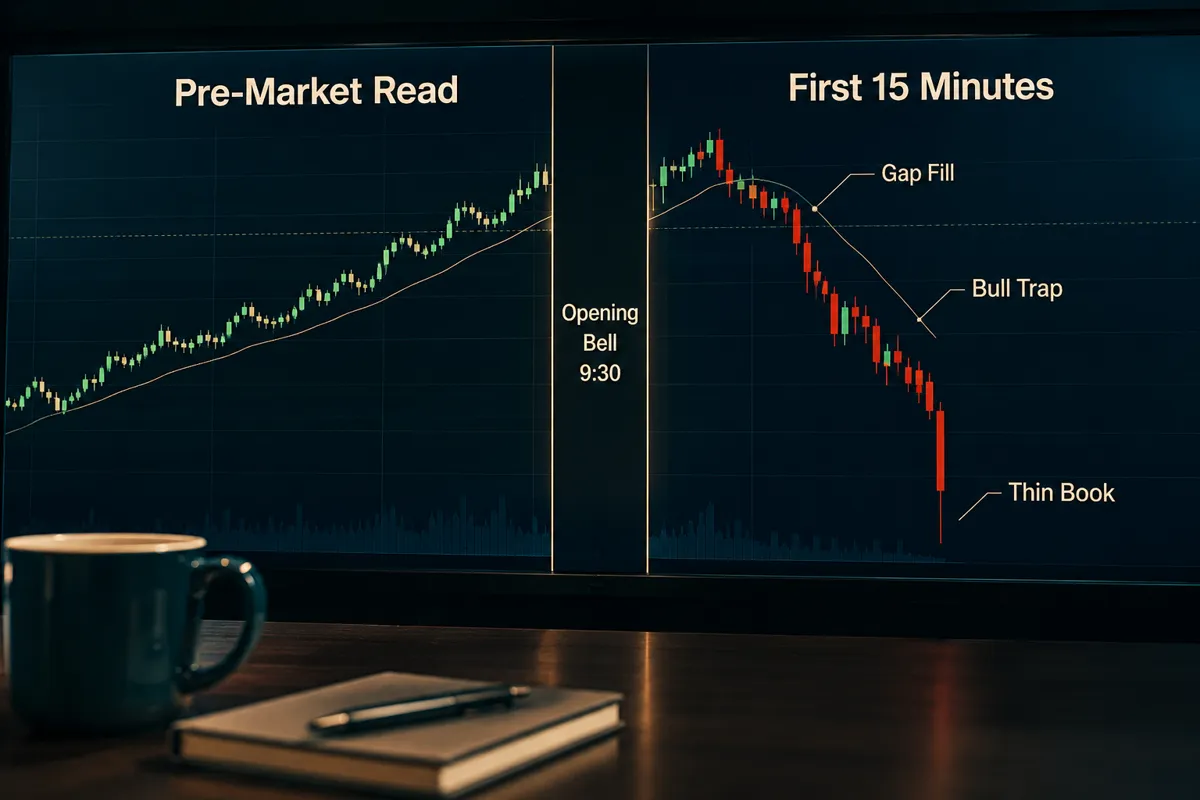
- The first 15 minutes after the open reverses the pre-market read often enough that "gap and go" and "gap fill" are both standard playbooks. Pick one in advance.
- Free beats paid here. Nothing about reading pre market futures today requires a subscription.
What Do Pre Market Futures Today Actually Track?
Pre market futures today track a contract on a future value of an index, not the index. That distinction sounds academic until it costs you money at 9:31 a.m.
An E-mini S&P 500 futures contract (ticker ES) is an agreement to settle against the S&P 500 at a specific expiration date. Because that settlement sits in the future, the price includes the cost of carry: interest rates minus expected dividends over the remaining life of the contract. That adjustment is fair value, and it's why the ES print and the S&P 500 cash index rarely show the same number.
Think of it like a plane ticket for a flight three months out versus the seat you're sitting in right now. Same destination, different price, and the difference is time and money.
The four contracts retail traders actually watch
- ES (E-mini S&P 500) tracks the broad market. The default read for overall risk appetite.
- NQ (E-mini Nasdaq-100) tracks large-cap tech. Moves harder and faster than ES.
- YM (E-mini Dow) tracks the Dow Jones Industrial Average, a price-weighted index of 30 large NYSE and Nasdaq stocks. The E-mini Dow is valued at $5 times the DJIA level, and it's the most widely traded of the Dow contract types.
- RTY (E-mini Russell 2000) tracks small caps. The best single read on domestic risk appetite and credit sensitivity.
The session that never really closes
CME Globex, the exchange's electronic platform, runs the near-continuous session. Trading opens Sunday at 6:00 p.m. ET and runs through Friday 5:00 p.m. ET, with a one-hour maintenance halt each weekday from 5:00 to 6:00 p.m. ET. That's why a headline out of Tokyo at 2 a.m. ET shows up in your futures quote before any US stock has traded a single share.
Practical takeaway: if you're comparing a futures level to yesterday's index close and getting confused, you're comparing two different instruments. Compare futures to futures.
Which 5 Pre-Market Signals Actually Predict the Open?
Five signals, in order of how much weight they deserve. Direction alone isn't one of them, which is exactly why most pre-market reads fail.
Signal 1 - Where Futures Sit at 8:30 a.m. ET, Not at 4:00 a.m.
The single highest-value futures read of the morning happens between 8:30 and 9:15 a.m. ET, after the major US economic releases land and before the cash open.
Overnight futures moves happen when almost nobody is trading. A 30-point ES move at 3 a.m. on a few thousand contracts is a rounding error dressed up as a trend. The same 30 points at 8:45 a.m., after the data, with real volume behind it, is a genuine repricing.
Decision rule: don't set your bias before 8:30 a.m. ET. Write down the 8:30 to 8:45 a.m. range and treat that as your reference, not the overnight high or low.
Common mistake: building a watchlist at 5 a.m. based on the overnight tape, then refusing to update it when the 8:30 print goes the other way. That's sunk-cost bias with a Bloomberg subscription.
Signal 2 - Gap Size Measured Against Average True Range
A gap only matters relative to how much a stock or index normally moves. Average true range (ATR) is the average distance between a session's high and low over a lookback period, usually 14 days. It's the ruler.
If ES normally covers 60 points of range in a day and pre-market futures point to a 12-point gap, that's a fifth of a normal day's move. Ordinary. If the same 60-point-ATR market is gapping 55 points, something structurally changed overnight and the usual mean-reversion assumptions go out the window.
- Gap under roughly 25% of ATR: background noise. Trade your normal setups.
- Gap between 25% and 75% of ATR: meaningful. Expect the first 30 minutes to be choppy while the market argues about fair price.
- Gap above 75% of ATR: a repricing event. Position sizing should shrink, not grow, because your stop distance just widened.
Position sizing note: bigger gap means bigger required stop distance, which means smaller share count for the same dollar risk. Traders who forget this step take a normal-sized position into an abnormal-sized range and wonder why one trade wrecked the week.
Signal 3 - Pre-Market Volume Behind the Move
Volume is what separates a real pre-market move from a quote artifact. A stock up 8% on 4,000 shares hasn't moved. One market maker just repriced a thin book.
On August 31, 2026, Investing.com's pre-market movers page showed NVIDIA at 218.90, up 1.35 points (+0.62%) on roughly 3.69 million shares. That's a credible pre-market read: liquid name, real size, modest move. Compare that with the same page's steep single-name declines, Edison International down 13.84 points (-19.72%) and PG&E down 3.14 points (-18.92%). Those are event-driven repricings, and event-driven pre-market prices can move again violently at 9:30.
Rough working thresholds for large-cap US equities in the pre-market:
- Under 50,000 shares: treat the quote as indicative, not tradable.
- 50,000 to 500,000 shares: real interest, but the spread will still cost you.
- Above 500,000 shares: institutional participation. The pre-market price carries information.
Signal 4 - The 8:30 a.m. Economic Print
8:30 a.m. ET is when the calendar resets the tape. CPI, PPI, jobless claims, non-farm payrolls, GDP revisions and retail sales data land in that slot, and index futures reprice instantly.
Anything you concluded at 6 a.m. is provisional until that release clears. Weekly and monthly readings feed the same machine, and traders use them to adjust growth and policy expectations. Investing.com's pre-market dashboard embeds the Redbook year-over-year retail sales index, which was showing a previous reading of 9.10% as of the August 31, 2026 snapshot, as a high-frequency gauge of US consumer spending.
Edge case worth knowing: on days with no 8:30 release, the pre-market read tends to hold better into the open, because there's no scheduled catalyst to reset it. Check the economic calendar first. It takes twenty seconds and changes how much you should trust the overnight tape.
Signal 5 - Sector Breadth Versus a Single-Name Catalyst
Ask one question: is the whole market moving, or is one sector dragging the index? The answer changes your entire plan.
Broad-based futures weakness across ES, NQ, YM and RTY together points to a macro driver: rates, a geopolitical headline, a global risk-off session. MarketWatch's futures data section in late August 2026 highlighted stock futures trading relatively flat even as US and Canada trade tensions escalated, a reminder that macro headlines and futures prices don't always move in lockstep.
Compare that with dispersion. As of late evening August 31, 2026, Yahoo Finance showed S&P 500 futures at 7,690.00 (-0.41%), Dow futures at 53,432.00 (-0.28%), Nasdaq futures at 29,320.25 (-0.58%) and Russell 2000 futures at 2,967.10 (-0.35%). Modest, uniform softness at the index level, while individual names swung from +2.75% (Devon Energy) to -19.72% (Edison) in pre-market. That's a stock-picker's tape, not an index-selling tape.
Practical takeaway: if all four index contracts are down together, respect the macro and reduce size. If the index is flat while individual names are on fire in both directions, ignore the index and trade the names. Data over noise.
Where Can You Read Futures Free Before the Bell?
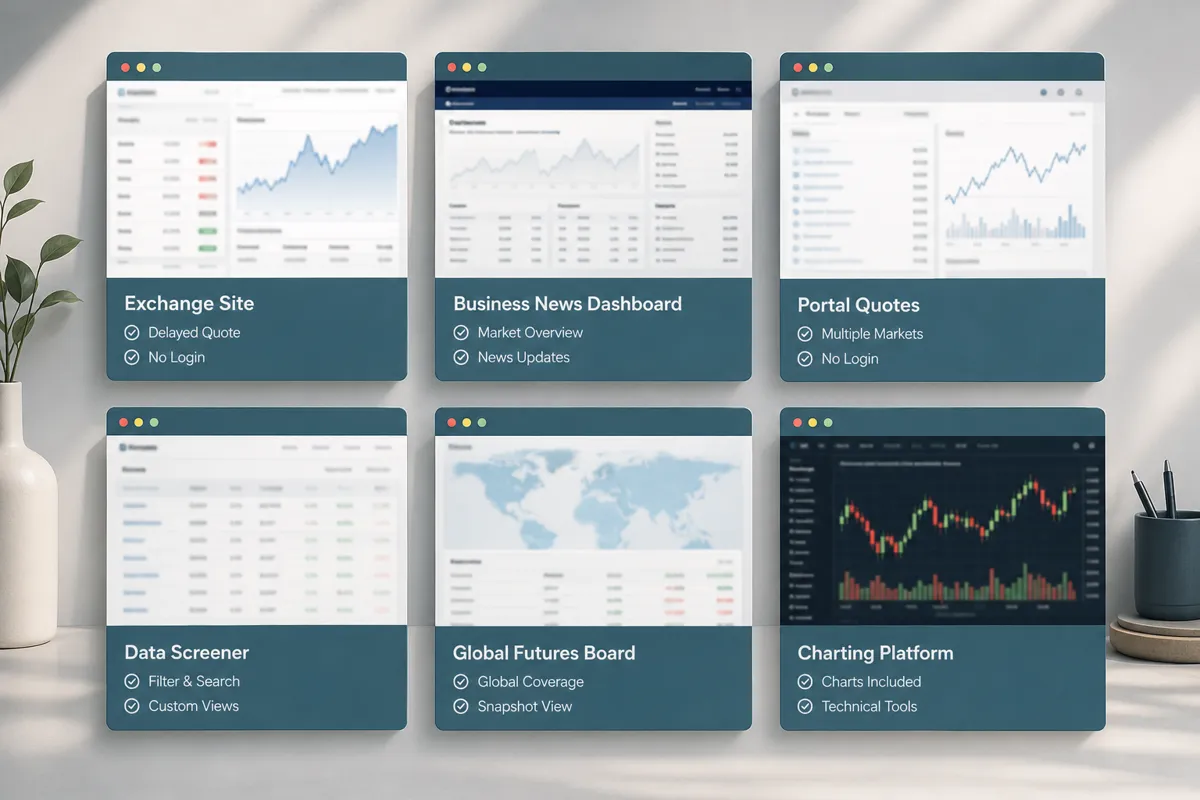
You do not need a paid data feed to read pre market futures today. Every reliable source below is free, and several are real-time or near-real-time.
The trade-off across free sources is almost always the same: delay versus depth. Exchange sites give you authoritative but slower quotes. News dashboards give you speed plus context. Charting platforms give you the chart but not the professional data feed.
| Source | Futures quote | Login needed | What else you get |
|---|---|---|---|
| CME Group | Delayed on the free public pages | No | Contract specs, expirations, volume and open interest straight from the exchange |
| CNBC pre-markets | Real-time to near-real-time (*S&P FUT, *DOW FUT, *NAS FUT) | No | Point and percent change plus volume, alongside live morning news coverage |
| Yahoo Finance | Near-real-time index futures quotes | No (login adds portfolio) | Four index contracts on one screen, plus single-stock pre-market prints |
| Barchart | Delayed on the free tier | Free account for full screeners | Deep futures screeners, technical readouts and multi-expiration chains |
| Investing.com | Roughly 10-minute delay on index futures | No | Pre-market movers list, economic calendar and embedded macro readings |
| TradingView free tier | Delayed futures without a paid data add-on | Yes, for saved charts and alerts | Best free charting, plus cross-asset futures (gold, crude, ags) for risk context |
Two more worth bookmarking: CNN's pre-markets page still serves unadjusted index futures data on a maintained feed, and Bloomberg's futures overview aggregates global equity and commodity contracts, which in the September 1, 2026 snapshot showed a major US index future near 7,692.00 and an Asian index future around 25,338.00 HKD.
Decision rule: pick one delayed source for context and one real-time source for execution. Running six tabs of the same quote isn't research, it's analysis paralysis.
If you want to build a repeatable morning routine instead of tab-hopping, the FullStack Alpha stock market guides collection covers process construction, and the 200+ term trading and options glossary explains any vocabulary in this piece you'd rather not Google separately.
Why Do Green Futures Still Open Red?
Because overnight futures and the 9:30 cash open are priced by two completely different crowds. Overnight is a thin market of algorithms, global desks and hedgers. 9:30 is where US institutional order flow shows up all at once.
Four mechanisms explain most reversals:
- Fair value drift. Futures include cost of carry, so the futures move and the implied cash open aren't identical. A small futures gain can translate to a flat or negative implied open.
- The 8:30 reset. A soft inflation or labor print can erase eight hours of overnight strength in ninety seconds.
- Opening auction imbalance. NYSE and Nasdaq opening auctions match accumulated market-on-open orders. If that imbalance leans the other way, the first print fights the futures.
- Gap fill mechanics. Traders who bought the overnight rally sell into the open to lock gains, which pulls price back toward the prior close. That's the gap fill, and it's one of the most common first-hour patterns on the tape.
Honest limit: pre-market signals set expectations. They do not remove risk. The first 15 minutes after the open regularly reverses the pre-market read entirely, which is precisely why professional traders often wait for the 9:45 a.m. reference range before committing size.
Common mistake: treating a strong pre-market as permission to skip your stop loss. A wide gap plus no stop is how a small account becomes a smaller account.
What Time Does Pre-Market Trading Actually Start?
Two different sessions, two different clocks. Confusing them is the most common beginner error in this whole topic.
Index futures trade on CME Globex nearly around the clock: Sunday 6:00 p.m. ET open, Friday 5:00 p.m. ET close, with a daily maintenance pause from 5:00 to 6:00 p.m. ET. There is no separate "pre-market" for futures. It's one continuous session.
Pre-market equity trading is different. Most retail brokers open the extended-hours equity session around 4:00 a.m. ET and run it to the 9:30 a.m. cash open. Some brokers offer overnight or near-24-hour equity trading through alternative venues, and coverage varies by broker, so check your own broker's published extended-hours schedule rather than assuming.
Liquidity inside the pre-market equity session climbs in stages:
| Window (ET) | What's happening |
|---|---|
| 4:00 to 7:00 a.m. | Thinnest books, widest spreads. Quotes often unreliable. |
| 7:00 to 8:30 a.m. | Overnight earnings reactions get priced. Volume builds. |
| 8:30 to 9:15 a.m. | Economic data lands. The most informative window of the morning. |
| 9:15 to 9:30 a.m. | Opening auction imbalances publish. Final positioning. |
Practical takeaway: if you only have twenty minutes of screen time before the bell, spend it between 8:40 and 9:00 a.m. ET. That's where the information density is highest.
Pre-market futures versus after-hours trading
After-hours equity trading runs roughly 4:00 p.m. to 8:00 p.m. ET and reacts to earnings released after the close. Futures keep trading right through it (minus the 5 to 6 p.m. maintenance break), which is why an after-hours earnings blowup shows up in ES and NQ long before the next pre-market session opens. Futures are the continuous instrument. Extended-hours equity trading is a series of thin windows.
How Much Pre-Market Volume Counts as Real?
For index futures, real volume means volume that grows through the morning rather than a single overnight burst. For individual stocks, the working floor is a meaningful percentage of the name's average daily volume, not a raw share count.
A 100,000-share pre-market print in a stock that trades 40 million shares a day is nothing. The same 100,000 shares in a name that trades 800,000 a day is a genuine event.
- Under 1% of average daily volume: informational only.
- 1% to 5% of average daily volume: real participation. Worth a watchlist slot.
- Above 5% of average daily volume: a catalyst is in play. Expect an unusually wide opening range.
For traders using scanners to sort this out at speed, tools like MarketReader's market-explanation platform and MarketBeat's data and screening suite both surface pre-market movers with volume context attached. If you're evaluating whether an AI-driven scanner is genuinely useful or just a wrapper, what beginners get wrong about AI for stock market research is the honest version.
Why aren't my pre-market futures orders filling?
Five usual culprits, in order of frequency:
- You sent a market order into a thin book. Extended-hours sessions on most brokers accept limit orders only, and a market order gets rejected outright.
- Your limit price is outside the current spread. Pre-market spreads can be many times wider than during regular hours. Your limit at the midpoint may never trade.
- Extended-hours permission isn't enabled. Many brokers require you to opt in per order or per account.
- The contract or session is closed. Trying to trade futures between 5:00 and 6:00 p.m. ET hits the Globex maintenance window.
- Order type unsupported. Stop orders, trailing stops and some conditional orders frequently don't route in extended hours. Check your broker's rules before you rely on a stop that won't exist.
Fix: use limit orders, size smaller, and accept that you may not get filled. Not getting filled in a thin market is often the market doing you a favor.
Can You Trade Pre-Market Futures With a Small Account?
Yes, and this is where the honest math matters more than the enthusiasm. Micro contracts (MES, MNQ, MYM, M2K) are one-tenth the size of their E-mini counterparts, which brings notional exposure and margin requirements down to a range a small account can actually manage.
Two hard truths:
- Futures are leveraged instruments. An E-mini Dow contract is valued at $5 times the DJIA level, so a 200-point index move is $1,000 per contract. Leverage amplifies overnight gaps in both directions.
- Overnight margin is higher than intraday margin at most brokers. A position you can hold at 2 p.m. may not be a position you can hold at 2 a.m.
Decision rule: if a single adverse overnight gap of 1.5x your normal stop distance would cost more than 2% of your account, the position is too big. Full stop. Paper trade the pre-market session for 20 sessions before you fund it, and log every trade with the 8:30 a.m. futures level noted at entry.
Do Pre-Market Futures Matter More for Day Traders or Long-Term Investors?
Day traders should read pre market futures today every session. Long-term investors mostly shouldn't.
For day traders: the pre-market read sets the opening range expectation, the gap direction, and the watchlist. Skipping it means walking into the open blind. The 8:30 to 9:15 a.m. window is functionally part of the job.
For long-term investors: pre market futures today is entertainment that occasionally becomes anxiety. A 0.41% overnight dip in S&P 500 futures has no bearing on a 15-year holding period. Checking it daily trains you to react to noise, which is how buy-and-hold portfolios accidentally become badly-timed trading accounts.
For swing traders: somewhere in between. The pre-market read matters on days you're planning an entry or exit, and matters much less on days you're holding.
If AI tools are part of your workflow, the honest overview of AI stock market apps traders are actually using covers which categories help a pre-market routine and which just add another notification to ignore.
What Are the Biggest Mistakes People Make Reading Pre-Market Futures?
Six mistakes, all preventable, all common.
- Setting bias before 8:30 a.m. ET. The overnight tape gets overwritten by the data print more often than traders admit.
- Confusing futures level with implied open. Fair value means the two numbers differ. Use an implied-open figure if your platform provides one.
- Chasing a pre-market mover at the open. A stock already up 15% pre-market with a wide spread is not a clean setup. It's FOMO with a ticker attached.
- Ignoring the economic calendar. Trading a Thursday morning without knowing whether CPI drops at 8:30 is a self-inflicted wound.
- Using market orders in extended hours. Play stupid games. Limit orders only.
- Treating index futures as gospel while individual names disagree. The August 31, 2026 tape is the textbook case: soft index futures across all four contracts alongside single-name moves ranging from +2.75% to -19.72%. That dispersion was the actual signal.
The fix for all six: write a one-page pre-market checklist and run it in the same order every morning. Check the calendar, note the 8:30 level, measure the gap against ATR, confirm volume, check breadth, then size the position. Systems over hacks.
How Do You Measure a Pre-Market Gap Against ATR?
Gap Size vs Average True Range
Enter the pre-market gap and the 14-day ATR in the same units (points or dollars).
Educational tool only. Not trading advice. Thresholds are general guidelines, not rules.
Frequently Asked Questions
Are pre-market futures a reliable predictor of the stock market open?
Partially. Futures direction at 9:15 a.m. ET correlates reasonably well with the direction of the opening print, but magnitude is unreliable and the first 15 minutes frequently reverses the move. Futures set expectations, not outcomes.
Where can I see pre market futures today for free and in real time?
CNBC's pre-markets and index-futures pages publish real-time to near-real-time quotes for Dow, S&P 500 and Nasdaq futures with no login. Yahoo Finance and CNN's pre-markets page are also free and require no account. Investing.com is free but runs on roughly a 10-minute delay for index futures.
Why do futures and the stock index show different numbers?
Futures include cost of carry: financing costs minus expected dividends until expiration. That adjustment is fair value, and it's why the E-mini S&P 500 print and the S&P 500 cash index never match exactly.
What hours do index futures trade?
CME Globex index futures trade from Sunday 6:00 p.m. ET through Friday 5:00 p.m. ET, with a daily maintenance halt from 5:00 to 6:00 p.m. ET. Equity pre-market sessions at most retail brokers run roughly 4:00 a.m. to 9:30 a.m. ET.
Can I trade futures with a $2,000 account?
Micro contracts (MES, MNQ, MYM, M2K) make it mechanically possible, since each is one-tenth the size of the equivalent E-mini. Whether it's survivable depends entirely on position sizing and stop discipline, and overnight margin is typically higher than intraday margin.
What's the difference between pre-market futures and after-hours trading?
Futures trade almost continuously, so they absorb after-hours earnings news, overnight global sessions and pre-market data in one unbroken tape. After-hours equity trading is a separate thin window, roughly 4:00 to 8:00 p.m. ET, in individual stocks only.
Final Verdict
Pre market futures today is a genuinely useful input and a genuinely terrible crystal ball. Read it at 8:45 a.m. instead of 4:00 a.m., measure the gap against ATR, confirm with volume, check the calendar, and ask whether the index or a single name is doing the moving. Five signals, one checklist, same order every morning. Discipline beats prediction.
Next step: build the checklist tonight. Five lines on one page, taped next to the monitor. Run it for 20 sessions and log what the 8:30 futures level did versus the 9:45 price. The data will argue back, and it'll argue better than any guru on your feed. Cut the noise, keep the alpha.
Free tools and honest reviews of the scanners and AI stock tools that actually help a pre-market routine are catalogued in the FullStack Alpha directory traders bookmarked early.
One tool won't fix a missing process, and no dashboard replaces a checklist. 200+ AI stock tools are catalogued in the FullStack Alpha directory, filterable by category, price and what they actually do.
Browse the directory → aistockpickerapps.com
References
Premarkets - https://www.cnn.com/markets/premarkets
Indices Futures - https://www.investing.com/indices/indices-futures
Pre Markets - https://www.cnbc.com/markets/pre-markets/
Futures - https://www.bloomberg.com/markets/stocks/futures
tradingview - https://www.tradingview.com/markets/usa/
Pre Market - https://www.investing.com/equities/pre-market
Futures - https://www.marketwatch.com/market-data/futures
Index Futures - https://www.cnbc.com/markets/index-futures/
Yahoo Finance index futures quotes, August 31, 2026 snapshot
Business Insider, Dow futures overview
DowFutures.org, Dow futures contract mechanics and trading schedule
Disclosure: some links on this site are affiliate links. We may earn a commission at no extra cost to you.