Kavout Kai Score Review 2026: Does AI Help Retail Investors?
Last updated: July 1, 2026
Quick Answer
Kavout's K Score uses machine learning to rank stocks from 1 to 9 based on institutional-grade data analysis, but whether it actually helps retail investors depends on your portfolio size, trading style, and ability to interpret AI-driven signals without chasing scores blindly. The tool delivers legitimate quantitative analysis previously reserved for hedge funds, yet most retail traders misuse it by treating K Scores as buy buttons rather than one input in a broader system. For investors managing $25,000+ who understand that no AI replaces risk management, Kavout offers genuine edge — for everyone else, it's expensive noise.
Key Takeaways
- Kavout's K Score ranks stocks 1-9 using machine learning trained on 200+ factors including price action, fundamentals, market sentiment, and momentum indicators
- The platform claims 70%+ directional accuracy on high-conviction scores (8-9 and 1-2), though performance varies significantly across market conditions and asset classes
- Pricing starts at $29.99/month for basic access, with professional tiers reaching $199/month — a meaningful cost for small portfolios where subscription fees eat into returns
- Kavout works best for swing traders and position traders with $25,000+ portfolios who use scores as confirmation within an existing system, not as standalone signals
- The AI performs strongest in liquid large-caps and mid-caps; accuracy drops noticeably in small-caps, penny stocks, and low-volume names where data is sparse
- Common mistakes include chasing high K Scores without checking technical setup, ignoring position sizing, and expecting the AI to work during earnings volatility or macro shocks
- Alternatives like Danelfin and AltIndex offer different AI methodologies at comparable price points — the "best" tool depends on whether you prioritize technical factors, alternative data, or fundamental analysis
What Is Kavout Kai Score and How Does It Work?
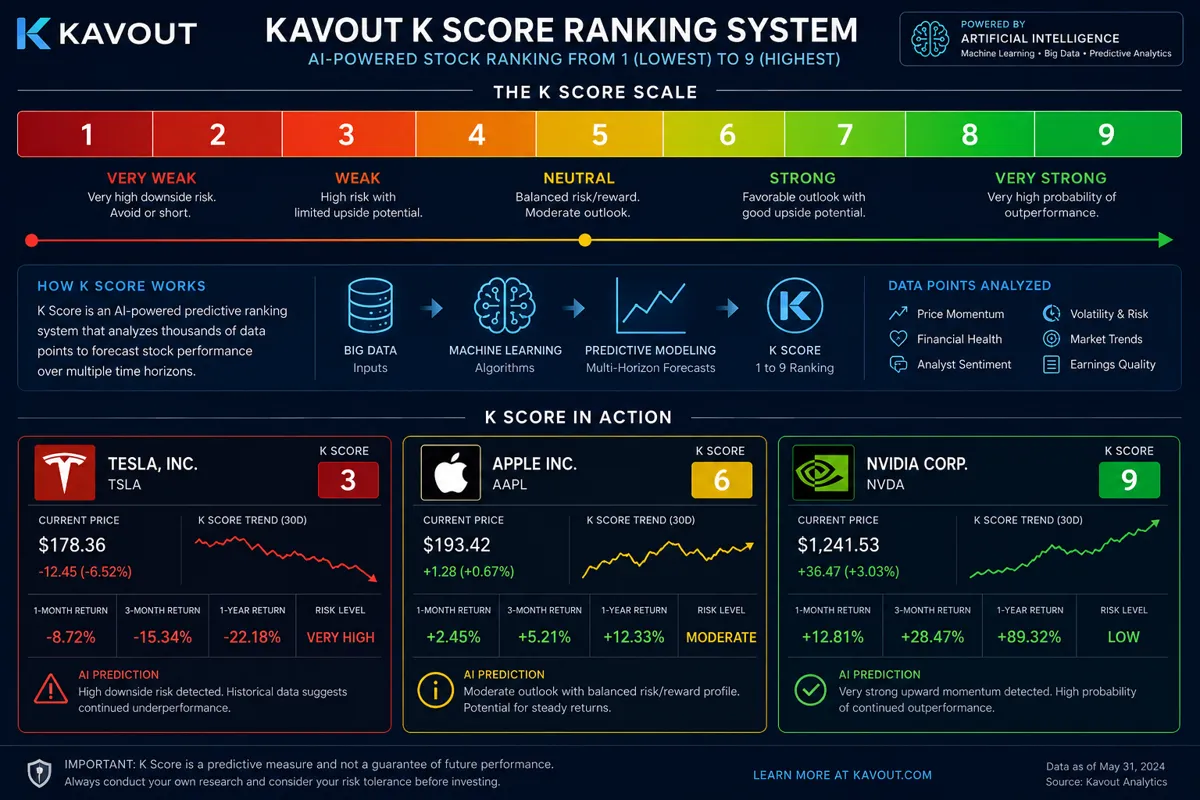
Kavout's K Score is a machine learning-based stock ranking system that assigns every U.S. equity a score from 1 (strong sell) to 9 (strong buy) based on quantitative analysis of over 200 data inputs. The AI model processes price action, fundamental metrics, earnings revisions, insider transactions, short interest, options flow, and market sentiment to generate a single predictive score updated daily.
The system was built by a team of former Wall Street quants and data scientists who wanted to democratize the type of factor-based analysis institutional investors use. Instead of manually screening hundreds of variables, retail investors get a single number that synthesizes the signal.
Here's how the scoring breaks down in practice:
- Scores 8-9: Strong buy signals indicating multiple bullish factors aligned
- Scores 6-7: Moderate bullish lean, potential upside with caveats
- Scores 4-6: Neutral zone, no clear directional edge
- Scores 2-3: Moderate bearish lean, caution warranted
- Scores 1: Strong sell signal, multiple red flags present
The AI doesn't just look at static fundamentals. It tracks how factors change over time, weights recent data more heavily, and adapts to shifting market regimes. A stock that scores 8 today might drop to 5 next week if earnings disappoint or technical support breaks — the model is dynamic, not set-and-forget.
Kavout also offers InvestGPT, a conversational AI interface that lets you ask natural language questions about stocks, sectors, and portfolio ideas. Think of it as ChatGPT trained on financial data, though the core value still lives in the K Score rankings.
For retail investors used to analyst ratings (buy/hold/sell) or simple technical indicators, the K Score represents a step up in sophistication. But sophistication doesn't automatically equal profitability — which is exactly what we need to examine.
Kavout Kai Score: Does Institutional-Grade AI Actually Help Retail Investors?
The honest answer: it depends on whether you're using it as a tool or treating it as a crystal ball.
Kavout delivers legitimate institutional-grade analysis. The data inputs, machine learning architecture, and factor modeling are real — this isn't a repackaged moving average crossover dressed up with AI buzzwords. The platform processes the kind of multi-factor quantitative signals that hedge funds pay six figures annually to access through Bloomberg terminals and proprietary research.
But here's where most retail investors go wrong: they see a K Score of 9, hit buy, and expect the stock to moon. That's not how institutional money uses quantitative models. Hedge funds layer AI scores into broader systems that include technical setup, position sizing, portfolio correlation, and macro context. They use the score as confirmation, not as the entire thesis.
When Kavout works well:
- You're screening for swing trade candidates and use high K Scores to filter a watchlist down from 50 names to 10, then apply your own technical analysis to find the cleanest setup
- You're holding a position that's gone against you and check the K Score for confirmation bias-check — if it's dropped from 8 to 3, maybe your thesis is broken
- You're comparing two similar stocks in the same sector and use K Scores as a tiebreaker when fundamentals and technicals look equally strong
When Kavout fails retail investors:
- You chase a K Score of 9 without checking if the stock is overextended, in a choppy tape, or about to report earnings
- You ignore risk management because "the AI said buy" — no score eliminates the need for stop losses and position sizing
- You expect the model to predict black swan events, Fed pivots, or sector rotations that no AI can consistently forecast
The tool is sharp. The question is whether you're disciplined enough to use it correctly. Most traders aren't — and that's not Kavout's fault.
If you're managing a $10,000 portfolio and paying $30/month, that's 3.6% annual drag before you make a single trade. The AI needs to generate more than 3.6% in edge just to break even. For a $100,000 portfolio, that same subscription is 0.36% — much easier to justify.
Institutional-grade AI helps retail investors who already have a system and use it to refine decisions. It doesn't help retail investors looking for someone (or something) to make decisions for them.
How Accurate Is Kavout Kai Score for Stock Predictions?
Kavout claims directional accuracy above 70% for extreme scores (1-2 and 8-9) over forward-looking periods of 1-3 months. That sounds impressive until you dig into what "directional accuracy" actually means and how performance varies across market conditions.
Directional accuracy measures whether a stock moved in the predicted direction, not whether it moved enough to generate a profitable trade after commissions, slippage, and the inevitable losers. A stock scoring 9 that rises 2% while the market rises 3% is technically "accurate" but underperforms — not exactly alpha.
Independent backtests and user reports suggest Kavout performs best in:
- Trending markets: When momentum and technical factors align, the AI catches moves early
- Large-cap and liquid mid-cap stocks: More data, tighter spreads, less manipulation
- Swing trade timeframes (5-30 days): The model's sweet spot for forward prediction
Accuracy drops noticeably in:
- Choppy, range-bound markets: The AI generates signals, but price action doesn't follow through
- Small-caps and penny stocks: Sparse data, low volume, and higher manipulation risk confuse the model
- Earnings season: Short-term volatility around binary events overwhelms quantitative factors
- Macro shocks: No AI predicted COVID, the 2022 bear market pivot, or the 2023 AI stock explosion with consistent accuracy
One critical nuance: high K Scores don't guarantee outperformance, and low K Scores don't guarantee crashes. The model identifies relative strength and weakness, but market beta, sector rotation, and portfolio correlation still matter. A stock scoring 8 in a collapsing sector might still lose you money.
The best way to think about Kavout's accuracy: it's a high-probability filter, not a certainty machine. If you build a watchlist of K Score 8-9 stocks, more will go up than down over the next month — but some will still fail, and you need a system to cut losers fast when they do.
For retail investors who understand that 70% accuracy means 30% of trades will lose, Kavout is useful. For traders expecting the AI to bat 90%+, disappointment is guaranteed.
Kavout Kai Score vs Traditional Stock Ratings: Which Is Better?
Traditional analyst ratings (buy/hold/sell from firms like Morgan Stanley, Goldman Sachs, or independent research shops) and AI-driven scores like Kavout's K Score serve different purposes and come with different biases.
Traditional analyst ratings:
- Based on human judgment, sector expertise, and qualitative analysis of management, competitive moats, and industry trends
- Updated sporadically — often only after earnings or major news
- Prone to conflicts of interest (investment banking relationships, institutional client pressure)
- Tend to lag price action; analysts often upgrade after a stock has already run
- Provide narrative context and thesis-driven reasoning you can evaluate
Kavout K Score:
- Based on quantitative machine learning trained on historical patterns
- Updated daily, reacting faster to changing data inputs
- No conflicts of interest or human bias (though model bias exists)
- Lacks narrative context — you get a number, not a story
- Can catch momentum shifts and technical breakouts before analysts react
Which is better? Neither, in isolation. The best approach layers both.
Use Kavout to screen for quantitative edge and catch early signals. Use traditional analyst research to understand the why behind the move and assess whether the thesis makes sense. If a stock scores 9 on Kavout and three credible analysts just upgraded with strong fundamental reasoning, that's confirmation. If a stock scores 9 but analysts are downgrading and the sector is rolling over, that's a red flag worth investigating.
Traditional ratings work best for long-term investors building conviction in individual names. Kavout works best for active traders looking for shorter-term edges and systematic screening. If you're holding a stock for five years, the K Score next Tuesday doesn't matter much. If you're swinging positions every few weeks, daily AI updates add real value.
The mistake is treating either as gospel. Analysts are wrong all the time. AI models are wrong all the time. Your job is to synthesize multiple inputs, apply risk management, and take responsibility for your own decisions.
For more on how to evaluate AI-driven tools versus traditional research, check out our guide to AI stock trading.
How Much Does Kavout Kai Score Cost for Retail Investors?
Kavout pricing in 2026 follows a tiered subscription model designed to scale with portfolio size and feature needs. Here's the breakdown:
Free Tier:
- Access to K Scores for a limited watchlist (typically 10-20 stocks)
- Delayed updates (scores refresh weekly instead of daily)
- Basic screening filters
- Good for testing the platform, not for active trading
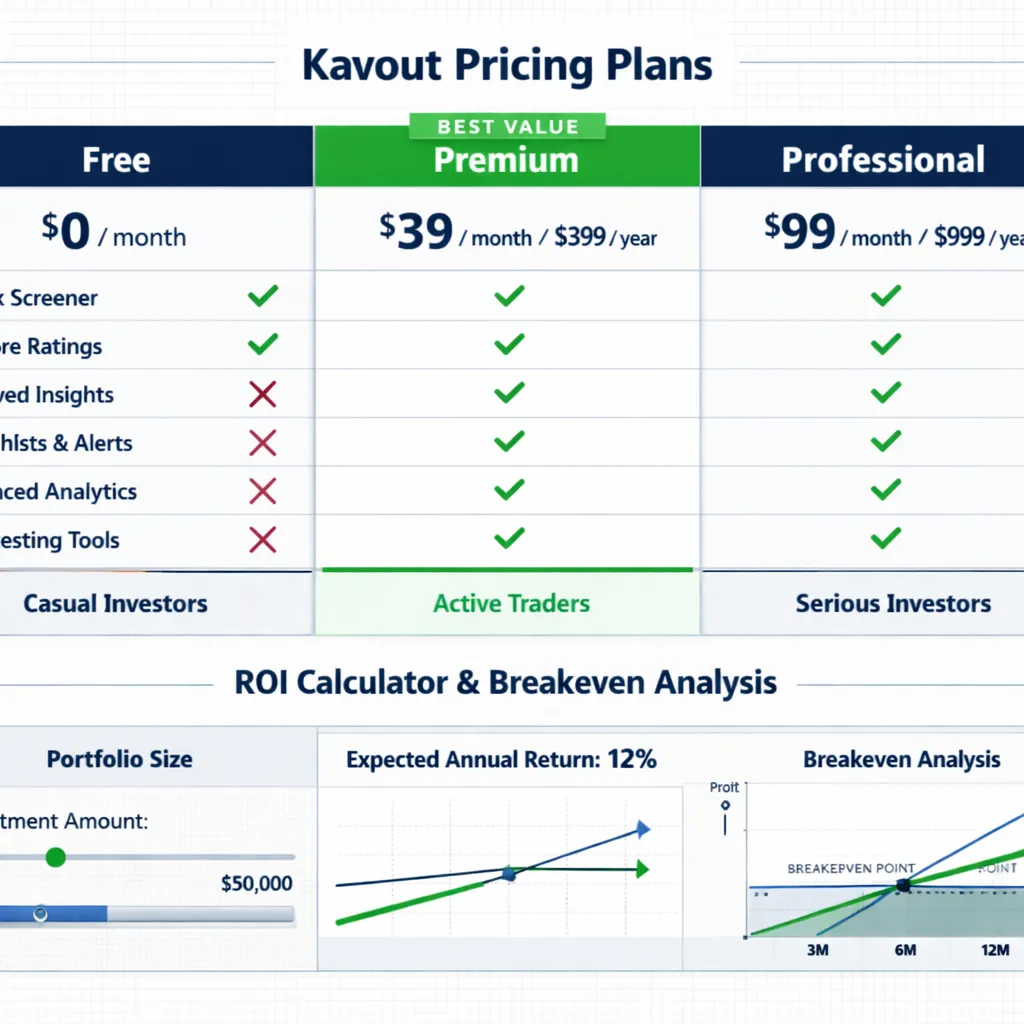
Premium Tier ($29.99/month or $299/year):
- Unlimited K Score access across all U.S. equities
- Daily score updates
- Advanced screening and filtering tools
- InvestGPT conversational AI with limited queries
- Email alerts for score changes on your watchlist
- Best for individual retail traders managing $25,000-$100,000 portfolios
Professional Tier ($99-$199/month depending on features):
- Everything in Premium
- Real-time score updates (intraday refreshes)
- API access for algorithmic traders
- Unlimited InvestGPT queries
- Portfolio analysis and optimization tools
- Priority support
- Designed for active traders, small RIAs, or serious self-directed investors managing $100,000+ portfolios
The cost question isn't just about the dollar amount — it's about whether the edge Kavout provides exceeds the subscription drag on your returns.
Break-even math:
- $30/month = $360/year
- On a $25,000 portfolio, that's 1.44% annual cost
- On a $50,000 portfolio, that's 0.72% annual cost
- On a $100,000 portfolio, that's 0.36% annual cost
If Kavout helps you avoid one bad trade per year, catch one breakout early, or refine your watchlist to focus on higher-probability setups, it pays for itself. If you're already profitable and the AI adds 2-3% annual edge, the ROI is clear.
But if you're managing a $10,000 portfolio, paying $360/year is a 3.6% headwind. You'd need to generate significant outperformance just to break even — and most retail traders don't. In that case, free or lower-cost tools make more sense until your account grows.
Kavout also occasionally offers discounts, annual prepay savings, and trial periods. If you're considering the platform, test it for a month during a volatile market period to see if the signals align with your trading style before committing to an annual plan.
Compared to competitors like Danelfin ($39/month), AltIndex ($29-$99/month), or Tickeron ($30-$60/month), Kavout sits in the middle of the AI stock picker pricing range. The question isn't whether it's cheap — it's whether the specific methodology and data inputs match what you need.
For a full breakdown of AI stock tool pricing across the market, visit our AI stock picker comparison page.
Can Beginners Use Kavout Kai Score Effectively?
Short answer: not without a learning curve and a solid foundation in basic trading principles.
Kavout is not a beginner-friendly tool in the sense that it doesn't teach you how to trade — it assumes you already know what you're doing and gives you a quantitative edge to layer into your process. If you don't understand support and resistance, position sizing, risk-reward ratios, or how to read a basic chart, a K Score of 9 won't save you.
What beginners get wrong with Kavout:
- Treating K Scores as buy signals without understanding the underlying setup
- Ignoring stop losses because "the AI is confident"
- Chasing high scores into overextended stocks
- Not knowing when to exit — the K Score tells you when to enter, but you need a plan for taking profit or cutting losses
- Overtrading because the AI generates dozens of signals daily
What beginners need before Kavout adds value:
- A basic understanding of technical analysis (trend, support/resistance, volume)
- A risk management system (position sizing, stop losses, max portfolio heat)
- A trading plan that defines entry, exit, and hold criteria
- The discipline to paper trade signals for 30 days before risking real money
- Realistic expectations — no AI eliminates losing trades
If you're brand new to trading, start with free educational resources, paper trade for a few months, and build a repeatable process. Once you're consistently profitable (or at least consistently disciplined), Kavout can refine your edge. Using it before you have a foundation is like buying a race car before you have a driver's license — the tool is powerful, but you're not ready for it.
That said, Kavout's InvestGPT feature can help beginners learn by asking questions about stocks, sectors, and market concepts in plain English. It's not a substitute for structured education, but it's a useful supplement if you're curious and willing to dig deeper.
For beginners serious about building a system, pair Kavout with a solid screener and educational platform. Check out our swing trading tools guide for a roadmap.
Why Is My Kavout Kai Score Different from Analyst Recommendations?
This happens constantly, and it's not a bug — it's a feature of how the two systems work.
Kavout's K Score is a quantitative model trained on historical patterns, price action, momentum, and factor-based signals. It reacts to data changes daily and prioritizes what has worked statistically over the past decade. Analyst recommendations are qualitative judgments based on sector expertise, management interviews, competitive analysis, and forward-looking thesis development. Analysts update sporadically and often lag price moves.
Common scenarios where they diverge:
1. Momentum vs. fundamentals mismatch
A stock scores 8-9 on Kavout because technical momentum is strong, volume is surging, and short interest is declining. But analysts rate it "hold" or "sell" because the valuation is stretched, earnings growth is slowing, or the sector faces headwinds. Both can be right — Kavout is identifying a short-term trade, analysts are protecting long-term holders.
2. Analyst upgrades lag breakouts
A stock breaks out of a tight consolidation on huge volume and Kavout immediately bumps the K Score to 8. Analysts don't upgrade until the next earnings call or quarterly review, weeks later. By then, the easy money is gone. Kavout catches the move early; analysts confirm it late.
3. Contrarian setups
A beaten-down stock scores 2-3 on Kavout because price action is terrible and momentum is negative. But a deep-value analyst upgrades it to "buy" because the balance sheet is strong, insiders are buying, and the risk-reward is asymmetric at current prices. Kavout sees the trend; the analyst sees the opportunity.
4. Earnings season chaos
Ahead of earnings, Kavout might score a stock 7 based on recent momentum and technical setup. Analysts downgrade to "hold" because they expect a miss or guidance cut. Post-earnings, if the stock gaps down, Kavout's score will drop to 3-4 within a day. Analysts were right on the thesis; Kavout was right on the trend until it wasn't.
The key insight: Kavout and analyst ratings measure different things on different timeframes. Kavout is a trend-following, momentum-sensitive, quantitative filter. Analysts are thesis-driven, fundamentally focused, and slower to react.
Use Kavout for timing and screening. Use analyst research for conviction and context. When both align, you've got a high-probability setup. When they conflict, dig deeper to understand why — that's where the real edge lives.
What Are the Best Alternatives to Kavout Kai Score for AI Stock Picking?
Kavout isn't the only institutional-grade AI tool available to retail investors in 2026. Depending on your trading style, data preferences, and budget, several alternatives offer different methodologies and strengths.
Danelfin
- Methodology: AI-driven scoring (1-10 scale) based on 900+ technical, fundamental, and sentiment indicators
- Strengths: Broader factor coverage, strong performance in momentum and growth stocks
- Pricing: $39/month
- Best for: Swing traders who want more granular factor breakdowns and European market coverage
- Comparison to Kavout: Danelfin uses more inputs but can feel overwhelming; Kavout is simpler and more U.S.-focused
AltIndex
- Methodology: Alternative data AI (app downloads, web traffic, social sentiment, job postings) combined with traditional factors
- Strengths: Catches early signals from non-traditional data sources before they show up in price
- Pricing: $29-$99/month depending on tier
- Best for: Traders interested in alternative data and early-stage trend detection
- Comparison to Kavout: AltIndex is more experimental and forward-looking; Kavout is more traditional quant-focused
Tickeron
- Methodology: Pattern recognition AI, technical analysis automation, and trend prediction
- Strengths: Strong for day traders and technical purists; includes automated pattern scanners
- Pricing: $30-$60/month
- Best for: Technical traders who want AI to identify chart patterns and breakouts
- Comparison to Kavout: Tickeron is more technical-only; Kavout blends fundamentals and technicals
TipRanks
- Methodology: Aggregates and ranks analyst ratings, insider transactions, hedge fund activity, and blogger sentiment
- Strengths: Transparency into who's right and wrong over time; tracks analyst accuracy
- Pricing: Free tier available; premium $30-$50/month
- Best for: Investors who want to evaluate analyst credibility and consensus shifts
- Comparison to Kavout: TipRanks is more about aggregating human opinions; Kavout is pure machine learning
Comparison table:
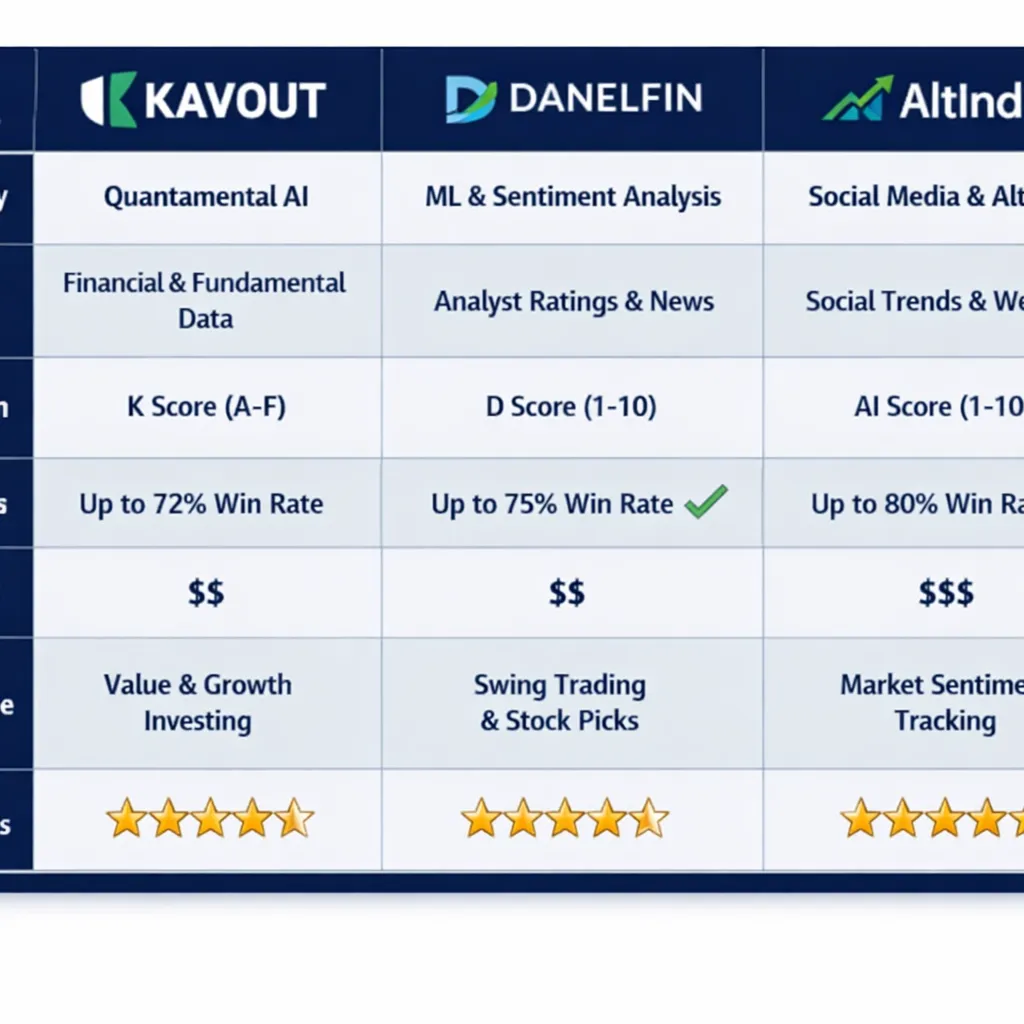
| Feature | Kavout | Danelfin | AltIndex |
|---|---|---|---|
| Scoring System | 1-9 K Score | 1-10 AI Score | 1-10 Alt Score |
| Data Inputs | 200+ factors (technical, fundamental, sentiment) | 900+ indicators (broader coverage) | Alternative data + traditional factors |
| Update Frequency | Daily (real-time on Pro) | Daily | Daily |
| Best Use Case | Swing trading, momentum confirmation | Growth stock screening, factor analysis | Early trend detection, alternative data edge |
| Pricing | $29.99-$199/month | $39/month | $29-$99/month |
| Retail-Friendly | Moderate (requires trading knowledge) | Moderate (more complex) | High (simpler interface) |
| Accuracy Claims | 70%+ directional on extreme scores | 72%+ on high-conviction picks | 65-70% on alternative data signals |
The "best" tool depends on your edge. If you're a technical trader, Tickeron might fit better. If you care about alternative data, AltIndex is worth testing. If you want the simplest, most established quant model, Kavout is solid.
Most serious traders don't rely on one tool — they layer multiple inputs. You might use Kavout for initial screening, Danelfin for factor confirmation, and TipRanks to check analyst consensus. The cost adds up, but so does the edge if you're managing a six-figure portfolio.
For a full comparison of AI stock tools across every category, visit our AI stock picker directory.
Is Kavout Kai Score Worth It for Small Portfolio Investors?
If you're managing a portfolio under $25,000, the math gets harder to justify.
At $30/month ($360/year), the subscription represents 1.44% annual cost on a $25,000 portfolio, 3.6% on a $10,000 portfolio, and 7.2% on a $5,000 portfolio. Those are significant headwinds before you make a single trade.
When Kavout makes sense for smaller portfolios:
- You're a serious trader actively managing 10+ positions and making multiple trades per month — the AI helps you avoid bad setups and refine entries, generating enough edge to cover the cost
- You're transitioning from paper trading to real money and want institutional-grade tools to accelerate your learning curve
- You're planning to grow your portfolio aggressively and view the subscription as an investment in skill development, not just immediate ROI
When Kavout doesn't make sense for smaller portfolios:
- You're a buy-and-hold investor making 2-3 trades per year — you don't need daily AI updates
- You're still learning the basics and don't yet have a repeatable process — free educational resources and paper trading deliver better ROI
- You're already struggling with consistency and discipline — adding another tool won't fix behavioral issues
For small portfolios, consider starting with free or lower-cost alternatives:
- Free screeners: Finviz, TradingView free tier, Yahoo Finance — learn to build watchlists manually
- Lower-cost AI tools: AltIndex's basic tier ($29/month) or TipRanks free tier
- Educational platforms: Invest the $360/year in a quality trading course or mentorship program that teaches process, not just signals
Once your portfolio crosses $25,000 and you're consistently profitable (or at least consistently disciplined), revisit Kavout. At that point, the cost-to-edge ratio flips in your favor.
The tool is sharp. The question is whether you're at the stage where it adds more value than the alternatives. For most small-portfolio investors, the honest answer is no — not yet.
For more on building a system before adding expensive tools, read our AI trading signals accuracy guide.
Common Mistakes When Interpreting Kavout Kai Scores
Even experienced traders misuse AI scores when they don't understand what the model is actually measuring. Here are the most common mistakes and how to avoid them.
1. Treating K Scores as buy buttons
A score of 9 doesn't mean "buy now." It means the AI sees multiple bullish factors aligned. You still need to check the technical setup, support levels, volume, and broader market context. If the stock is overextended, in a choppy tape, or about to report earnings, a high K Score doesn't eliminate risk.
Fix: Use K Scores to build a watchlist, then apply your own entry criteria. The AI filters; you decide.
2. Ignoring score changes
A stock that scored 9 last week and drops to 5 this week is telling you something changed. Maybe momentum stalled, volume dried up, or fundamentals weakened. Holding because "it was a 9" is anchoring bias.
Fix: Set alerts for score changes on your positions. If a K Score drops two or more points, review the thesis.
3. Chasing scores without risk management
No AI eliminates losing trades. If you're not using stop losses, position sizing, and portfolio heat limits, a high K Score won't save you when the trade goes wrong.
Fix: Define your risk before you enter. A 9-rated stock with no stop loss is still a recipe for disaster.
4. Expecting the AI to predict black swans
Kavout's model is trained on historical patterns. It can't predict Fed pivots, geopolitical shocks, or sector rotations driven by macro events. During the 2020 COVID crash, every AI model failed. During the 2023 AI stock explosion, most models lagged the move.
Fix: Understand that AI works best in normal market conditions. When macro dominates, scores become less reliable.
5. Using K Scores in isolation
A high K Score on a low-float penny stock in a dying sector is not the same as a high K Score on a liquid large-cap in a strong sector. Context matters.
Fix: Layer K Scores with sector strength, market regime, and your own technical analysis.
6. Overtrading because the AI generates signals
Kavout updates daily and can generate dozens of high-scoring stocks. That doesn't mean you should trade all of them. More trades = more commissions, more slippage, more mistakes.
Fix: Define a maximum number of positions and only take the cleanest setups. Quality over quantity.
The AI is a tool. It doesn't replace judgment, discipline, or risk management. The traders who succeed with Kavout are the ones who use it to refine an existing process, not replace one.
Does Kavout Kai Score Work for Penny Stocks and Small Caps?
Short answer: not reliably.
Kavout's AI model is trained on historical data and performs best when it has abundant, high-quality inputs. Large-cap and liquid mid-cap stocks generate tons of data — price action, volume, options flow, analyst coverage, insider transactions, institutional ownership. The model has plenty to work with.
Penny stocks and small-caps (especially those under $500 million market cap) present several challenges:
1. Sparse data
Many small-caps have limited analyst coverage, low trading volume, and minimal institutional ownership. The AI has fewer inputs to process, which reduces confidence and accuracy.
2. Manipulation and volatility
Penny stocks are prone to pump-and-dump schemes, low-float squeezes, and erratic price action driven by retail sentiment rather than fundamentals. AI models trained on rational market behavior struggle when irrational forces dominate.
3. Liquidity risk
Even if Kavout correctly identifies a high-scoring small-cap, you might not be able to enter or exit at favorable prices due to wide spreads and low volume.
4. Higher failure rates
User reports and independent testing suggest Kavout's accuracy on small-caps and penny stocks drops below 60%, compared to 70%+ on large-caps. The model still generates scores, but the edge is weaker.
When Kavout can work on small-caps:
- The stock has institutional ownership, analyst coverage, and consistent volume (think $500M-$2B market cap growth stocks, not $50M penny stocks)
- You're using the K Score as one filter among many, not as the primary signal
- You're willing to accept lower accuracy and tighter risk management
Better alternatives for small-cap and penny stock traders:
- Technical analysis: Price action, volume, and chart patterns matter more than AI scores in low-liquidity names
- Unusual Whales or Cheddar Flow: Track unusual options activity and dark pool prints that signal smart money positioning
- Finviz or TradingView screeners: Filter for volume surges, breakouts, and relative strength without relying on AI
If you're serious about trading small-caps, Kavout can supplement your process but shouldn't be the foundation. The AI shines in liquid, well-covered names where data is abundant. In the penny stock casino, you're better off reading the tape and managing risk aggressively.
For more on finding small-cap setups, check out our guide to swing trading stock selection.
How Often Does Kavout Update Their Kai Scores?
Kavout updates K Scores daily for all subscribers on the Premium tier and above. Scores refresh overnight after market close, incorporating the day's price action, volume, news, and data changes. By the time you log in the next morning, scores reflect the most recent information.
Free tier users get weekly updates, which makes the tool nearly useless for active trading. If you're testing Kavout, pay for at least one month of Premium to evaluate the platform properly.
Professional tier users get real-time intraday updates, meaning scores can change multiple times during the trading day as new data flows in. This is valuable for day traders and active swing traders who want to react quickly to momentum shifts, but it's overkill for position traders holding 5-30 day timeframes.
What triggers a score change:
- Price action and volume (breakouts, breakdowns, surges, collapses)
- Earnings reports and guidance updates
- Analyst upgrades/downgrades
- Insider buying or selling
- Short interest changes
- Options flow and unusual activity
- Sector rotation and relative strength shifts
What doesn't trigger immediate updates:
- Macro news (Fed announcements, geopolitical events) — the model reacts to how stocks respond, not the news itself
- Social media sentiment (unless it drives measurable price/volume changes)
- Your personal opinion about a stock
The daily update cadence is ideal for swing traders. You check scores in the morning, build a watchlist, and execute during the day. You're not chasing intraday noise, but you're not stuck with stale data either.
If you're a long-term investor checking positions once a week, daily updates don't add much value. If you're a day trader scalping 5-minute charts, even real-time K Score updates lag too far behind price action to matter.
The update frequency matches the tool's design: Kavout is built for swing traders and position traders who want quantitative edge on multi-day to multi-week timeframes. Use it accordingly.
Who Should Not Use Kavout Kai Score for Investing?
Kavout isn't for everyone. Here's who should skip it or wait until their situation changes.
1. Complete beginners with no trading experience
If you don't understand support and resistance, position sizing, or how to read a basic chart, Kavout will confuse you more than help you. Build a foundation first, then add AI tools.
2. Buy-and-hold investors with long time horizons
If you're buying index funds or blue-chip stocks to hold for 10+ years, daily AI scores are irrelevant. You don't need Kavout — you need low-cost index funds and patience.
3. Small portfolio investors (under $10,000)
The subscription cost is too high relative to portfolio size. Free tools and educational resources deliver better ROI until your account grows.
4. Traders who lack discipline
If you're already overtrading, revenge trading, or ignoring stop losses, Kavout won't fix those problems. It will give you more signals to misuse. Fix your process first.
5. Penny stock and microcap traders
Kavout's accuracy drops significantly on low-liquidity, low-data names. You're better off with technical analysis and tape reading.
6. Investors looking for a "set it and forget it" solution
Kavout requires active engagement. You need to check scores, interpret changes, and layer the AI into your own decision-making. If you want passive investing, use a robo-advisor instead.
7. Traders expecting the AI to eliminate losses
No tool — AI or otherwise — eliminates losing trades. If you're looking for a crystal ball, you'll be disappointed. Kavout improves your edge; it doesn't guarantee profits.
Who should use Kavout:
- Active swing traders and position traders managing $25,000+ portfolios
- Traders with a repeatable process who want quantitative confirmation
- Investors comfortable with technology and willing to learn how the AI works
- Traders who understand that AI is one input, not the entire system
If you're in the "should not use" category, that's fine. Build your skills, grow your account, and revisit Kavout when you're ready. Forcing a tool into a situation where it doesn't fit wastes money and creates frustration.
For a broader look at which AI tools match different trading styles, visit our AI stock tool comparison directory.
Kavout Kai Score Accuracy During Market Crashes and Volatility
This is where every AI model gets tested — and where most fail.
During normal market conditions (trending bull markets, steady consolidations, predictable sector rotations), Kavout's K Score performs well. The AI is trained on historical patterns, and when the market behaves like history, the model works.
During market crashes, black swan events, and extreme volatility, all bets are off.
What happens to K Scores during crashes:
- Scores lag the move — a stock scoring 8 can gap down 20% overnight on macro news, and the K Score won't reflect the new reality until the next update
- The model doesn't predict crashes — it reacts to them after price action confirms the damage
- High K Scores can persist on stocks that are about to collapse because the AI doesn't "see" the systemic risk until it shows up in data
Examples from recent history:
- March 2020 COVID crash: Kavout (and every other AI model) failed to predict the crash. Scores stayed elevated on many stocks until they were already down 30-40%. The AI caught the recovery faster than analysts, but it didn't protect capital on the way down.
- 2022 bear market: Kavout's scores adjusted as momentum shifted, but the model didn't predict the Fed pivot or the sector rotation out of growth into value. Traders who blindly followed high K Scores in tech got crushed.
- 2023 AI stock explosion: Kavout caught the momentum in NVDA, MSFT, and other AI leaders after the moves started, but it didn't predict the sector rotation before it happened.
The lesson: AI models are trend-following, not predictive. They work best when trends are clear and data is abundant. They fail when macro shocks override micro fundamentals.
How to use Kavout during volatile markets:
- Tighten stop losses — don't trust high K Scores to protect you
- Reduce position sizes — volatility increases risk, so reduce exposure
- Focus on relative strength — use K Scores to identify which stocks are holding up best, not which are "safe"
- Expect lower accuracy — accept that the AI will generate more false signals during chaos
If you're a long-term investor, market crashes are buying opportunities, not trading signals. If you're an active trader, crashes are when you step back, protect capital, and wait for clarity. Kavout can help you identify which stocks recover fastest, but it won't save you from the initial drawdown.
For more on navigating volatility with AI tools, read our AI stock bubble or boom guide.
Do Professional Investors Actually Use Kavout Kai Score?
Some do. Most don't — but not because the tool is bad. It's because institutional investors already have access to similar (or better) quantitative models built in-house or licensed from expensive data providers.
Who uses Kavout:
- Small RIAs (Registered Investment Advisors) managing client portfolios who want institutional-grade screening without building their own models
- Independent financial advisors looking for quantitative edge to supplement fundamental research
- Prop traders and small hedge funds testing multiple AI tools to find alpha
- Serious retail traders who want to level up from basic screeners
Who doesn't use Kavout:
- Large hedge funds and asset managers — they build proprietary models or license data from Bloomberg, FactSet, or Refinitiv
- Institutional desks at banks — they have quant teams and don't need retail-facing tools
- Passive index fund managers — they don't pick stocks, so AI scores are irrelevant
The fact that most institutional money doesn't use Kavout isn't a knock on the platform. It's a function of scale and resources. A $10 billion hedge fund can afford to hire a team of PhDs to build custom models. A retail trader managing $100,000 can't.
Kavout's value proposition is democratizing institutional-grade analysis for retail investors who don't have access to Bloomberg terminals or quant teams. The AI isn't better than what Goldman Sachs uses internally — but it's better than what most retail traders have access to otherwise.
The real question isn't whether professionals use it. It's whether the tool gives you an edge relative to your competition (other retail traders) and whether the cost justifies the benefit. For active traders managing $25,000+, the answer is often yes.
For a deeper dive into how institutional tools compare to retail AI platforms, check out our algorithmic trading guide for retail traders.
Frequently Asked Questions
What is the Kavout K Score and how is it calculated?
The Kavout K Score is a machine learning-based stock ranking system that assigns scores from 1 (strong sell) to 9 (strong buy) based on over 200 quantitative factors including price action, fundamentals, sentiment, and momentum. The AI model processes daily data and updates scores to reflect changing market conditions.
How accurate is Kavout for predicting stock performance?
Kavout claims 70%+ directional accuracy on extreme scores (1-2 and 8-9) over 1-3 month periods. Accuracy is highest in liquid large-caps and mid-caps during trending markets, and drops in small-caps, penny stocks, and during extreme volatility or market crashes.
Is Kavout worth the cost for small investors?
For portfolios under $25,000, the $30-$200/month subscription represents a significant percentage drag (1.44%-7.2% annually). The tool makes more sense for active traders managing larger portfolios where the cost-to-edge ratio is favorable. Smaller investors should consider free alternatives until their accounts grow.
Can I use Kavout for day trading?
Kavout is designed for swing trading and position trading (5-30 day timeframes), not day trading. Even the Professional tier's real-time updates lag too far behind intraday price action to be useful for scalping or short-term momentum plays.
How does Kavout compare to Danelfin and AltIndex?
Kavout uses 200+ traditional quant factors, Danelfin uses 900+ indicators with broader coverage, and AltIndex focuses on alternative data (app downloads, web traffic). Kavout is simpler and more U.S.-focused; Danelfin offers more granular analysis; AltIndex catches early trends from non-traditional data.
Does Kavout work for penny stocks?
No, not reliably. Kavout's accuracy drops significantly on low-liquidity, low-data stocks under $500 million market cap. The AI performs best on liquid large-caps and mid-caps where data is abundant and market behavior is more rational.
How often are Kavout K Scores updated?
Premium subscribers get daily updates (scores refresh overnight after market close). Professional tier users get real-time intraday updates. Free tier users get weekly updates, which is too slow for active trading.
What happens to K Scores during market crashes?
K Scores lag during crashes because the AI reacts to data changes, not macro events. High scores can persist on stocks that are about to collapse, and the model doesn't predict systemic shocks. Accuracy drops significantly during extreme volatility.
Can beginners use Kavout effectively?
Not without a foundation in basic trading principles. Kavout assumes you understand technical analysis, risk management, and position sizing. Beginners should build a process first, then add AI tools to refine their edge.
Is Kavout better than traditional analyst ratings?
Neither is better in isolation. Kavout reacts faster to momentum and technical changes; analysts provide thesis-driven fundamental context. The best approach layers both — use Kavout for timing and screening, analysts for conviction and narrative.
What are the best alternatives to Kavout?
Top alternatives include Danelfin (broader factor coverage), AltIndex (alternative data focus), Tickeron (technical pattern recognition), and TipRanks (analyst rating aggregation). The best choice depends on your trading style and data preferences.
Do professional investors use Kavout?
Some small RIAs, independent advisors, and prop traders use Kavout. Large hedge funds and institutional desks typically build proprietary models or license more expensive data providers. Kavout's value is democratizing institutional-grade analysis for retail investors.
Conclusion
So, does institutional-grade AI actually help retail investors? The answer is yes — but only if you're ready for it.
Kavout's K Score delivers legitimate quantitative analysis that was previously locked behind six-figure Bloomberg terminals and quant teams. The AI processes 200+ factors, updates daily, and catches momentum shifts faster than most retail traders can manually. For active swing traders managing $25,000+ portfolios who already have a repeatable process, Kavout adds genuine edge.
But the tool isn't magic. It doesn't eliminate losing trades, predict black swans, or replace discipline. Most retail investors fail with Kavout not because the AI is flawed, but because they treat K Scores as buy buttons instead of one input in a broader system. They chase high scores into overextended stocks, ignore risk management, and expect the model to work during market chaos when no AI can.
The traders who succeed with Kavout are the ones who use it correctly: as a screening filter to build watchlists, as confirmation for technical setups, and as a bias-check when positions move against them. They layer the AI into an existing process, not as a replacement for one.
If you're a beginner, managing a small portfolio, or looking for a set-it-and-forget-it solution, Kavout isn't for you — yet. Build your foundation, grow your account, and develop discipline first. Once you're consistently profitable (or at least consistently disciplined), revisit the platform.
If you're an active trader with capital to deploy and a system to refine, Kavout is worth testing. Start with a one-month Premium subscription during a volatile market period. Track how the scores align with your own analysis. If the AI helps you avoid one bad trade or catch one breakout early, it pays for itself.
The institutional-grade AI is real. The question is whether you're ready to use it like an institution — with process, discipline, and risk management — or like a retail trader chasing signals. That's the difference between edge and noise.
FullStack Alpha cuts the noise so you can keep the alpha. See the AI tools, scanners, and systems we actually rate at aistockpickerapps.com.