AI Stock Scanner: 5 Filters That Cut 200 Tickers to 5
Last updated: September 1, 2026
Most traders don't lose money because their AI stock scanner was bad. They lose money because they bought an AI stock scanner when what they actually needed was a screener, then tried to day trade off data that was fifteen minutes stale. A scanner watches live intraday price and volume and answers one question: what is moving right now. A screener runs on end-of-day fundamental and technical data and answers a different one: which companies fit this profile. Buy the wrong one and you're either paying for a real-time feed you never open, or you're chasing a move that finished before your chart drew it.
Key Takeaways
- A scanner is live and intraday. A screener is end-of-day and fundamental. They solve different problems and cost very different amounts.
- Five filters do most of the work: relative volume, float and share structure, price and average true range (ATR), a named catalyst, and relative strength against the index.
- Real-time data is a hard requirement for day trading and mostly optional for swing trading. Delayed feeds are free for a reason.
- Published scanner pricing spans roughly $0 (Thinkorswim, bundled with a Schwab account) up to $200-plus per month for tiers that include AI engines. Some vendors publish no price at all.
- AI in a scanner means pattern recognition and probability ranking, not prophecy. No scanner predicts prices.
- A scanner shortens the list. It does not tell you what to buy, where your stop goes, or how big your position should be.
- Fewer alerts beats more alerts. Three scans you trust will outperform twelve you ignore.
What Is an AI Stock Scanner and How Does It Work?
An AI stock scanner is software that watches the live market tick by tick and flags stocks matching conditions you define, with a machine-learning layer that ranks or classifies those hits instead of just listing them. The plain version alerts you when a stock crosses a threshold. The AI version tries to tell you which of those alerts historically preceded a continued move.
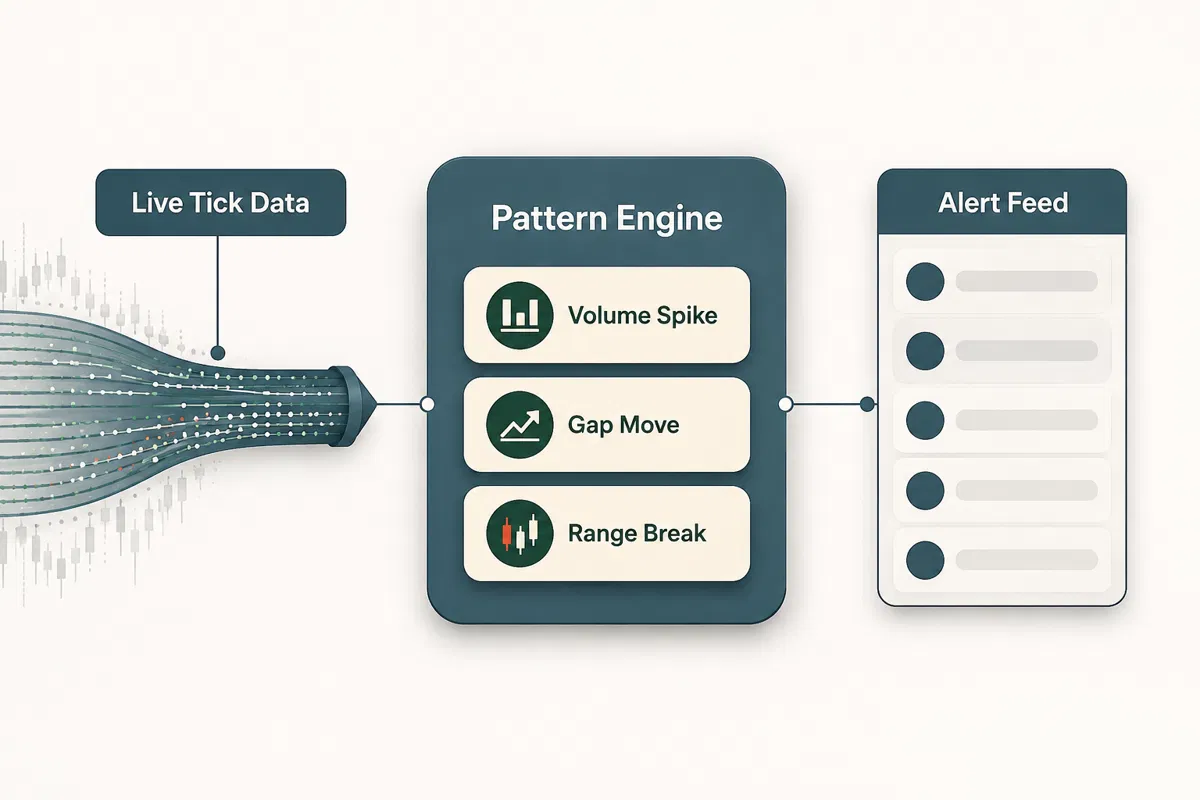
Under the hood, three things are happening.
- Data intake. A consolidated real-time feed streams price, volume, and sometimes options flow and news headlines.
- Condition matching. Your rules run against every ticker in the universe, continuously. Volume above average, gap up over 4%, break of yesterday's high, whatever you set.
- Ranking or classification. This is the AI part. Models compare the current setup against a library of prior ones and score it. Trade Ideas markets this as Holly, a set of strategy engines that re-run overnight on the prior session's data. TrendSpider does automated pattern and trendline detection on the chart itself.
Newer entrants have moved this into plain language. Ask The Desk, launched in 2026, lets a trader type a question about a stock and get an instant structured answer instead of building a filter by hand. AI Labs launched a retail-facing analytics platform in July 2026 with a similar pitch. Even brokers are wiring in: Reuters reported on August 25, 2026 that German broker Scalable Capital opened its investment platform to major AI chatbots.
Decision rule: if you cannot describe the market condition you want flagged in one sentence, you're not ready to pay for a scanner yet. Write the sentence first.
Scanner vs Screener: Which One Are You Actually Paying For?
A scanner is a stopwatch. A screener is a microscope. Paying for the wrong instrument is the single most common buying mistake in this category, and it's expensive because the real-time data feed is where most of the cost lives.
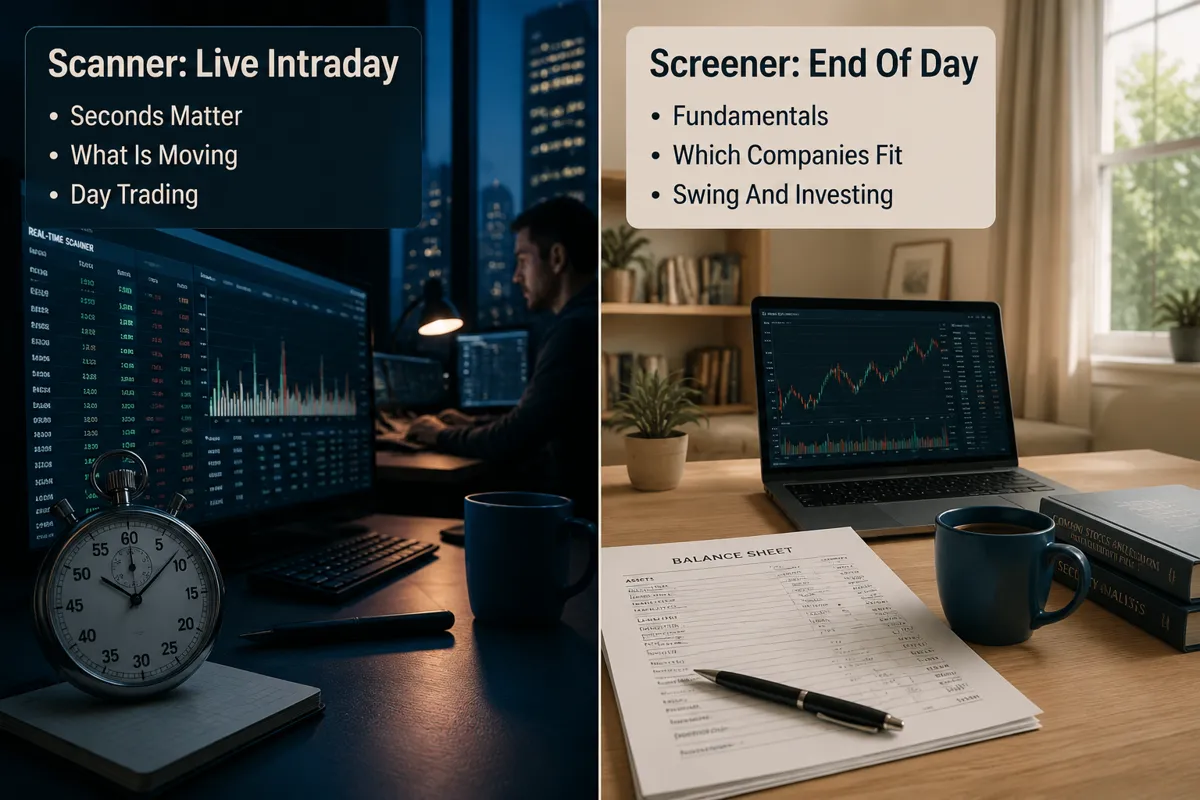
Quick separation:
- Scanner: live intraday data, seconds matter, output is "AAPL just spiked on 8x volume." Built for day traders and active swing entries.
- Screener: end-of-day or delayed data, output is "these 40 companies have a P/E under 15, revenue growth over 20%, and price above the 50-day moving average." Built for swing traders, position traders, and investors.
Finviz sits in an interesting middle. The free version is a screener with delayed data. Finviz Elite adds real-time quotes and intraday charts, which pushes it into scanner territory for slower setups. If your entire process is end-of-day, a screener is enough, and the comparison between Stock Rover and Finviz on screener value is a better use of your budget than a real-time subscription.
Common mistake: a swing trader who holds positions for eight days pays $200 a month for millisecond alerts, then only checks the platform at 8pm. That's a gym membership for a guy who owns a treadmill.
Which 5 Filters Cut a 200-Ticker List Down to 5?
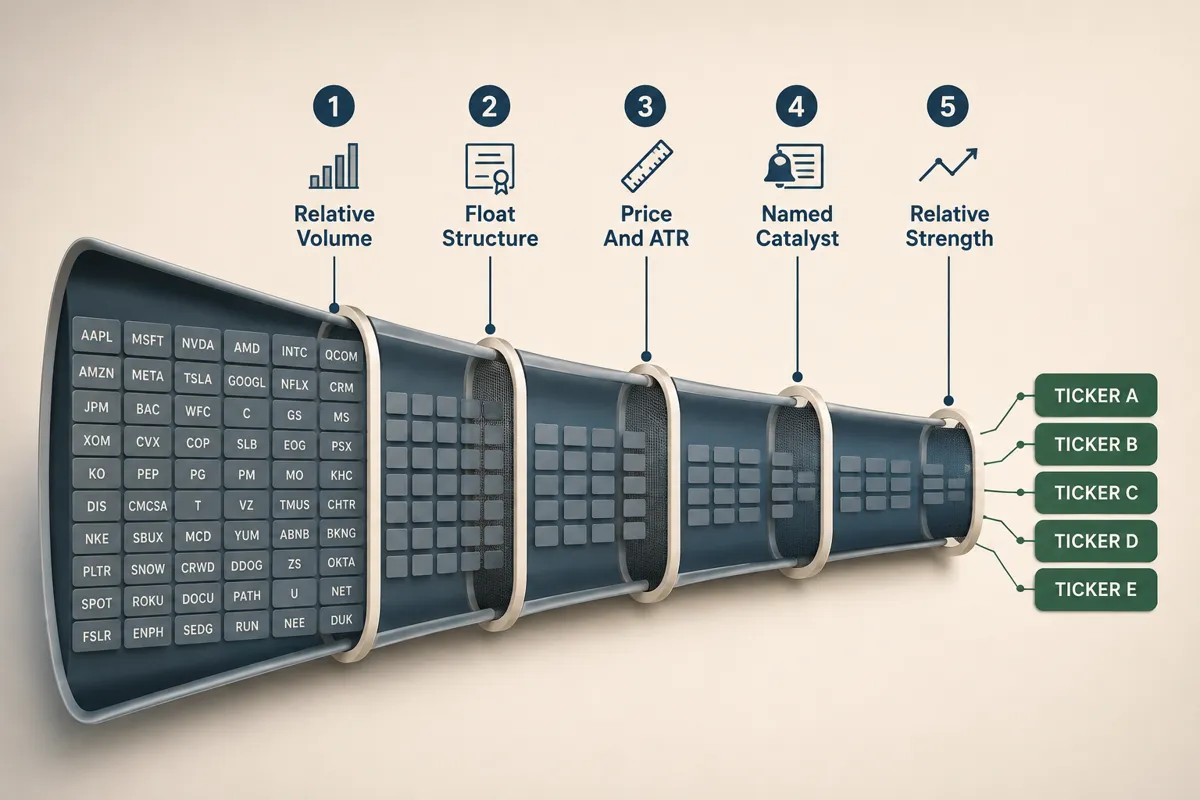
Five filters, run in this order, take a typical morning gap list of about 200 names down to a handful you can actually watch. The order matters because each one is cheaper to compute and easier to eyeball than the last.
Filter 1: Relative Volume Against the 30-Day Average
Relative volume (RVOL) compares today's volume at this exact time of day against the average for the same window over the past 30 sessions. RVOL of 1.0 means normal. RVOL of 5.0 means five times the usual crowd showed up.
Set the floor at 2.0 for swing setups and 3.0 or higher for intraday. Volume is the only filter that tells you other people care. A breakout on average volume is a rumor. A breakout on 6x volume is an argument.
This single filter typically kills more than half the list.
Filter 2: Float and Share Structure
Float is the number of shares actually available to trade, excluding insider and restricted holdings. Low float (under roughly 20 million shares) means less supply, so the same buying pressure moves price further and faster. It also means the move can reverse just as fast.
Day traders often want low float. Swing traders usually want the opposite, because thin names gap through stops overnight. Either way, check for recent dilution. A shelf registration or an at-the-market offering means the company can print new shares into your breakout, and those filings are public on the SEC's EDGAR database.
Filter 3: Price Range and Average True Range
Average true range (ATR) measures how far a stock typically travels in a day. If ATR is 1.5% of share price, there isn't enough movement to pay you for the risk, no matter how clean the chart looks.
A workable filter: price between $2 and $20 for intraday momentum, ATR at least 4% to 5% of price, and a bid-ask spread under a couple of cents. Sub-$1 names and wide spreads eat the edge before you enter. Illiquid tickers punish position sizing.
Filter 4: A Named Catalyst, Not Just a Move
If you cannot name why a stock is up, you're guessing. A catalyst is a specific, dated reason: an earnings beat, updated guidance, an FDA decision, a contract award, an index addition, a analyst upgrade with a published note.
Volume without a catalyst is often a bull trap, a move that sucks in buyers and then reverses hard. Bloomberg reported on August 20, 2026 that Hudson River signed a multibillion-dollar CoreWeave deal for AI cloud capacity, the kind of dated, checkable event that explains a move rather than decorating it. Scanners like Benzinga Pro exist mostly to attach the headline to the ticker in real time. Tools that explain why a stock just moved do the same job for slower traders.
Filter 5: Relative Strength Against the Index
Relative strength here means simple comparison: is the stock outperforming SPY or QQQ right now, today, on this bar? A stock up 3% while the index is up 3% is a passenger. A stock up 3% while the index is flat or red has real demand behind it.
This is the last filter and the most brutal. On a strong tape it barely trims the list. On a choppy tape, where the index whipsaws all session, it can empty your entire watchlist, which is useful information in itself.
Run all five and the funnel looks roughly like this: 200 names, RVOL cuts to 70, share structure to 40, price and ATR to 20, catalyst to 8, relative strength to 5. Those numbers are illustrative, not measured. Your own pass rates will differ by market condition, and tracking them for 30 sessions is more valuable than any vendor's backtest.
<!DOCTYPE html>
<html lang="en">
<head>
<meta charset="utf-8">
<meta name="viewport" content="width=device-width, initial-scale=1">
<title>Scanner Filter Funnel</title>
<style>
.cg-funnel{font-family:system-ui,-apple-system,Segoe UI,Roboto,sans-serif;max-width:560px;margin:0 auto;background:#F8FAFC;border:1px solid #E2E8E4;border-radius:12px;padding:18px;color:#0A1128}
.cg-funnel h3{margin:0 0 4px;font-size:18px}
.cg-funnel p.cg-sub{margin:0 0 14px;font-size:13px;color:#4a5568}
.cg-row{display:flex;align-items:center;gap:10px;padding:7px 0;font-size:14px;border-bottom:1px dashed #E2E8E4}
.cg-row label{cursor:pointer;flex:1}
.cg-row span{font-size:12px;color:#1F5E43;font-weight:600}
.cg-in{margin:12px 0 6px;font-size:14px}
.cg-in input{width:90px;padding:6px;border:1px solid #cbd5d0;border-radius:6px;font-size:14px}
.cg-out{margin-top:14px;background:#1F5E43;color:#fff;border-radius:10px;padding:14px;text-align:center}
.cg-out b{font-size:32px;display:block;line-height:1.1}
.cg-note{font-size:11px;color:#64748b;margin-top:10px;line-height:1.4}
</style>
</head>
<body>
<div class="cg-funnel">
<h3>Filter Funnel Estimator</h3>
<p class="cg-sub">Toggle the five filters to see how fast a watchlist shrinks. Pass rates are illustrative defaults, not measured results.</p>
<div class="cg-in">Starting tickers: <input id="cgStart" type="number" value="200" min="1" max="5000"></div>
<div id="cgRows"></div>
<div class="cg-out"><b id="cgRes">5</b>tickers left to watch</div>
<p class="cg-note">Track your own pass rates for 30 sessions and replace these defaults with real numbers.</p>
</div>
<script>
var F=[["Relative volume above 3x",0.35],["Float and share structure",0.57],["Price band and ATR",0.50],["Named catalyst",0.40],["Relative strength vs index",0.63]];
var rows=document.getElementById("cgRows");
F.forEach(function(f,i){
 var d=document.createElement("div");d.className="cg-row";
 d.innerHTML='<input type="checkbox" id="cgf'+i+'" checked><label for="cgf'+i+'">'+f+'</label><span>'+Math.round(f*100)+'% pass</span>';
 rows.appendChild(d);
});
function calc(){
 var n=parseFloat(document.getElementById("cgStart").value)||0;
 F.forEach(function(f,i){ if(document.getElementById("cgf"+i).checked){ n=n*f; } });
 document.getElementById("cgRes").textContent=Math.max(0,Math.round(n));
}
document.getElementById("cgStart").addEventListener("input",calc);
F.forEach(function(f,i){document.getElementById("cgf"+i).addEventListener("change",calc);});
calc();
</script>
</body>
</html>
How Much Does an AI Stock Scanner Cost Per Month?
Published monthly pricing in this category runs from free to over $200, and the price is driven almost entirely by whether a real-time consolidated data feed is bundled in. AI pattern detection adds a premium on top of that.
Rough tiers, based on vendor pricing pages checked in September 2026 (verify before you subscribe, because tiers move constantly):
- Free with a brokerage account: Thinkorswim's built-in scanner is included with a Schwab account, real-time data and all.
- Under $50 per month: Finviz Elite lists $39.50 monthly or $299.50 annually. Benzinga Pro's entry plan sits in the high $30s.
- $50 to $180 per month: TrendSpider's plan ladder covers most of this band depending on tier and billing cycle. Black Box Stocks publishes a price around $100 monthly. Benzinga Pro's plan with the audio squawk sits near the top of this range.
- $180 and up: Trade Ideas' premium tier, the one that includes the Holly AI engines, has historically been listed above $200 per month when billed monthly. Scanz sells in modules, which can stack past this quickly.
- No published price: Warrior Trading bundles its scanner with a training membership rather than selling it standalone, so a clean monthly scanner price isn't published.
Independent roundups such as ChartingLens's screener comparisons cover pricing across a wider set of tools, and category directories like F6S list dozens of AI investment analytics products.
Decision rule: if the monthly fee is more than 2% of your account, skip it. On a $5,000 account, $120 a month is 29% a year in fixed cost before you place a single trade.
Which AI Stock Scanners Are Worth the Subscription, and What Are the Alternatives?
The honest answer: match the data feed to your holding period, then pay the least you can for it. Below is how the named tools compare on the four things that decide the purchase.
| Tool | Data feed | Published monthly price (Sept 2026) | AI / pattern detection | Best fit |
|---|---|---|---|---|
| Trade Ideas (Holly) | Real-time | Premium tier above $200 | Yes, Holly strategy engines | Day trading |
| TrendSpider | Real-time on higher tiers | Roughly $50 to $180 by tier | Yes, automated pattern and trendline detection | Swing trading |
| Finviz Elite | Real-time (free tier delayed) | $39.50, or $299.50 per year | Limited, rules-based filters | Swing trading |
| Benzinga Pro | Real-time news and quotes | High $30s entry to near $200 with squawk | Partial, news classification | Day trading catalysts |
| Scanz | Real-time | Sold in stacking modules | Rules-based, pattern add-ons | Day trading |
| Black Box Stocks | Real-time, options flow | Around $100 | Yes, algorithmic alerts | Day trading, options |
| Warrior Trading scanner | Real-time | No standalone price published | Rules-based presets | Day trading (course bundle) |
| Thinkorswim scanner | Real-time with funded account | Included with Schwab account | No, custom rules only | Both, if you build the scan |
Prices above reflect vendor pages as of September 2026 and change without notice. Alternatives worth knowing: TradingView's built-in screener and alerts, AI scoring engines like Danelfin and Kavout that rank stocks rather than flag intraday movement, and natural-language tools like Ask The Desk. For head-to-head detail, see the breakdowns of TrendSpider's AI pattern scanner, Tickeron versus Trade Ideas, and Blackboxstocks.
Are There Free AI Stock Scanner Tools That Actually Work?
Yes, and for swing traders the free tier is often enough. The catch is data latency and alert limits, not filter quality.
What's genuinely usable at zero cost:
- Thinkorswim's scanner. Real-time, deeply configurable, free with a funded Schwab account. Hardest to learn, best value on the list.
- Finviz free. Delayed quotes, excellent filter breadth, fine for building an end-of-day watchlist.
- TradingView free tier. Screener plus a small number of active alerts. Enough to test a process before paying.
- Broker-native scanners on Webull, Fidelity, and others. Basic, but real-time on the quote side.
Free-tier and conversational AI scanners have multiplied through 2026, with entrants ranging from mobile-first apps to chat-based tools. Many are a public language model with a dashboard bolted on. Test the same query on two of them and see whether the answers agree.
Practical takeaway: run the five filters manually on a free scanner for 20 sessions. If you consistently produce a watchlist you'd trade, then pay for speed. Paying first is backwards.
Do You Need a Real-Time Data Feed to Run One?
If you day trade, yes, no exceptions. If you swing trade over multiple days, mostly no, and skipping it cuts your software bill by more than half.
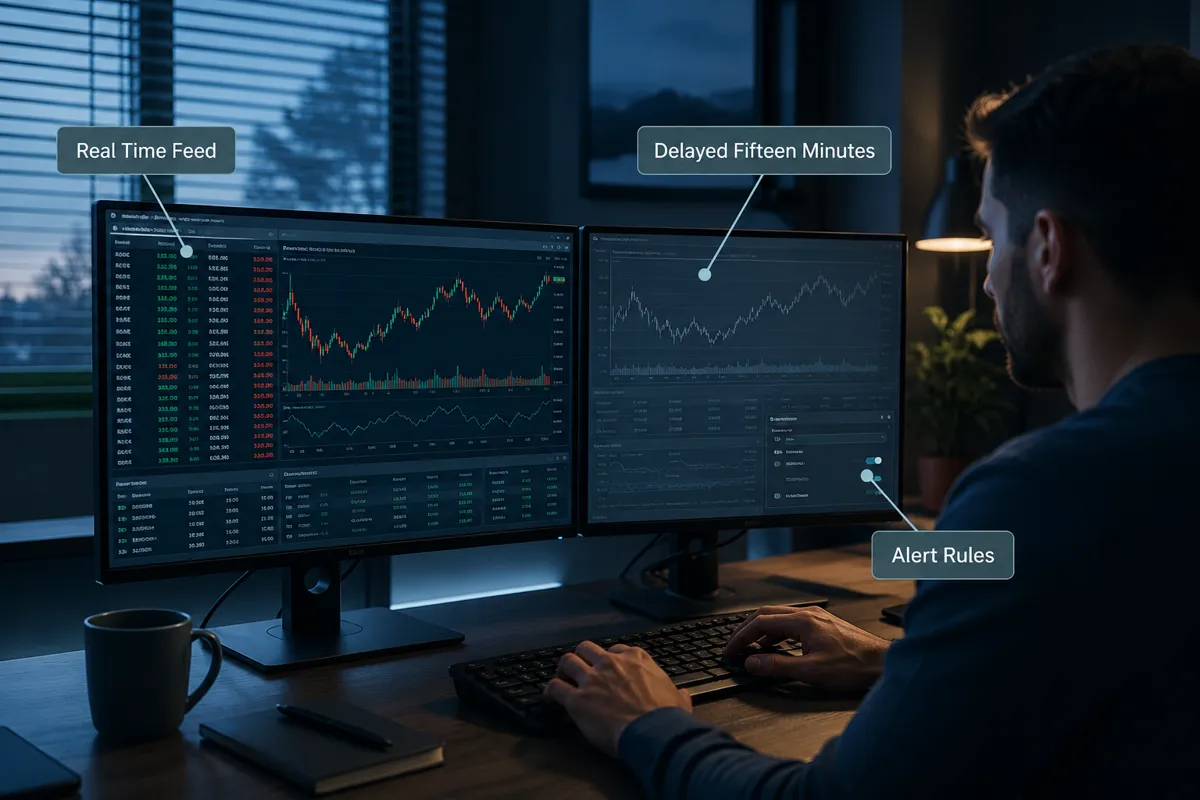
The math is simple. A 15-minute delayed feed on a stock with a 5% ATR means you can miss the entire first leg of a move before the data reaches your screen. That's not a scanner, that's a replay. For an intraday setup where the whole trade lasts eleven minutes, delayed data is worse than useless because it looks actionable.
Swing setups are different. A daily-chart breakout you plan tonight and enter tomorrow at the open does not care about milliseconds. FINRA's own investor material on day trading risk is worth reading before you commit to the faster, more expensive path.
Edge case: earnings gaps. Even swing traders benefit from real-time quotes in the first 30 minutes after an overnight gap, when the spread is wide and the open is chaotic.
Which AI Stock Scanner Is Best for Day Trading Versus Swing Trading?
For day trading, the answer is whichever real-time scanner you can configure fastest, with Trade Ideas and Black Box Stocks leading on speed and alert depth and Thinkorswim leading on cost. For swing trading, TrendSpider and Finviz Elite do more per dollar because pattern detection on daily charts matters more than latency.
Splitting it by holding period:
- Intraday (minutes to hours): real-time feed, RVOL and float filters, news squawk. Alerts fire on gaps, halts, and volume spikes.
- Swing (2 to 10 days): end-of-day or delayed data is fine. Filters lean on consolidation patterns, moving-average reclaims, and relative strength. The swing trading screener breakdown covers this setup in more depth.
- Long-term investing (months to years): you don't want a scanner at all. You want a fundamental screener plus filings analysis. Paying for intraday alerts here is pure waste.
Common mistake: buying a day trading scanner and using it for swing trades, then wondering why the alerts feel like noise. Different holding period, different tool.
Can an AI Stock Scanner Predict Stock Prices Accurately?
No. An AI stock scanner does not predict prices, and any vendor implying otherwise is selling a story. What the AI layer does is classify current conditions against historical patterns and assign a relative probability score. Useful, and a very different claim.
Two things to keep straight:
- Backtest is not live performance. A strategy engine that ranked well on 2019 to 2024 data has not proven anything about next Tuesday. Vendor-claimed win rates that aren't independently audited are marketing, not evidence.
- Pattern recognition degrades when the regime changes. Models trained on trending markets stop working on a choppy tape. Nobody announces this. Your P&L does.
Where AI genuinely helps: sorting 400 alerts into a priority order so a human reviews 15 instead of 400. Where it does not: telling you the price of anything tomorrow. If a tool markets accuracy percentages, read the honest take on AI research tools for beginners before you subscribe.
Do Professional Traders Use AI Stock Scanners?
Yes, though the professional version looks nothing like the retail product. Institutional desks build in-house scanning on direct exchange feeds, and the retail scanner market is essentially a consumer-grade version of that workflow.
The interesting shift is in the semi-professional tier. CNBC reported on August 1, 2026 that full-time prediction market traders are running custom AI bots and even dedicated antennas to shave latency. Multi-factor institutional-style scanning has also filtered down to retail platforms, and brokers themselves are integrating AI interfaces.
What the pros do differently:
- They measure the scanner's contribution. Hit rate by scan, tracked over hundreds of trades.
- They cut scans that stop working instead of adding new ones.
- They treat the scanner as an input to a documented process, not the process itself.
Takeaway: if you can't say which of your scans produced your last ten winners, you're running a hobby, not a system. Systems over hacks.
What Do Traders Get Wrong About Scanner Alerts?
The biggest error is volume. Traders set up twelve scans, get 300 alerts a day, and end up trading whichever ticker happened to buzz while they were looking at the phone. That's not a process, that's a slot machine with better graphics.
How to set up alerts that survive contact with a live market:
- Cap it at three scans. One momentum, one pullback, one catalyst. That's it.
- Cap it at 10 alerts per session. Tighten the filters until the volume fits the cap. If you get 40, your RVOL floor is too low.
- Set alerts at your entry level, not at the move. Alert on the break of a specific price you already identified, not on "up 5%." Alerting on the move guarantees you arrive late.
- Add a time-of-day window. Most momentum scans produce garbage between 11am and 2pm. Turn them off.
- Route alerts to one channel. Phone push or desktop, pick one. Both means you react twice.
- Log every alert you traded and every one you skipped. After 30 sessions you'll know which scan actually earns its keep.
Other repeat mistakes: treating every alert as a trade signal, skipping the stop loss because the alert "looked strong," and revenge trading the next alert after getting stopped out. The scanner has no opinion on your position size. That's still your job, and a position size calculator for swing trades handles it in ten seconds.
Why Is Your AI Stock Scanner Not Finding Any Trades?
Usually one of four reasons, and three of them are configuration, not the market. Empty results are sometimes the correct answer, so start by checking whether the tape is actually offering anything.
Troubleshooting order:
- Filters stacked too tight. Five conditions each passing 40% of names leaves you 1% of the universe. Loosen one filter at a time and see which one is doing the killing.
- Wrong universe. Scanning only S&P 500 names for low-float momentum returns nothing, by definition. Check exchange, market cap, and price bounds.
- Data feed not subscribed. A real-time scan running on a delayed entitlement will show stale or empty intraday fields. Check the entitlement, not the filter.
- Choppy tape. On a day when the index reverses three times, relative strength filters legitimately return zero. That's the tool telling you to sit out.
Edge case: the scan works at 9:35am and dies by 10:15am. That's normal. Momentum conditions are time-sensitive, and most volume-based scans stop producing after the open.
Can You Make Money With an AI Stock Scanner?
A scanner can improve your odds by putting better candidates in front of you. It cannot make you money on its own, and treating it as the profit engine is how traders talk themselves into paying $200 a month for a tool they use badly.
The scanner controls one variable: which stocks you look at. It has zero influence over the four that determine your results.
- Entry and exit rules
- Position sizing
- Stop loss discipline
- How many trades you take when you're bored
Anyone selling you the idea that better inputs fix a broken process has something to sell. The honest framing: a good AI stock scanner reduces the time cost of finding setups from two hours to twenty minutes. What you do with that time is the whole game. Investor.gov's material on active trading risk is a reasonable reality check before you scale up size.
Play stupid games. Buy the fastest scanner on the market, trade every alert without a stop, and the data feed will be the cheapest part of the month.
Frequently Asked Questions
What is the difference between a stock scanner and a stock screener?
A scanner runs on live intraday data and answers "what is moving right now." A screener runs on end-of-day fundamental and technical data and answers "which companies fit this profile." Scanners suit day traders. Screeners suit swing traders and investors.
Do I need a real-time data feed for swing trading?
Usually no. Daily-chart setups planned the night before and entered the next morning don't require intraday speed. Real-time quotes help in the first 30 minutes after an overnight gap, when spreads are widest.
How many filters should a scan use?
Three to five. Under three and you'll drown in alerts. Over six and you'll get empty results on most sessions. Start with relative volume, price range, and a catalyst, then add from there.
Can a free scanner replace a paid one?
For swing trading, often yes. Thinkorswim's scanner is real-time and free with a funded Schwab account, and Finviz's free screener covers end-of-day filtering well. Paid tools mainly buy speed, alert volume, and AI ranking.
Is AI pattern detection worth paying extra for?
Only if you're reviewing more alerts than you can read. The value of AI ranking is triage: sorting 300 hits into a top 15. If your scan already returns 8 names, you're paying for a feature you don't need.
How long should you test a scanner before paying for a year?
At least 30 trading sessions on a free trial or free tier, logging every alert you acted on and skipped. Annual plans discount 25% to 40% at most vendors, which is not worth locking in before you know the tool fits your holding period.
What Is the Final Verdict on AI Stock Scanners?
An AI stock scanner is a filter, not an oracle. Bought correctly, it turns a 200-name morning list into five tickers you can actually study, which is real value if your bottleneck is time. Bought incorrectly, it's a real-time data subscription funding alerts you ignore while you swing trade off daily charts. Match the data feed to your holding period, cap yourself at three scans, and let the five filters do the cutting.
Next three steps, in order:
- Write your holding period on paper. Minutes, days, or months. That single line decides scanner versus screener.
- Run the five filters on a free tool for 30 sessions and log the results.
- Only then pay, and pay for the cheapest tier that gives you the data your holding period actually needs.
Fewer tabs, fewer alerts, one clean process. Cut the noise, keep the alpha.
References
Best Ai Stock Screener - https://chartinglens.com/blog/best-ai-stock-screener
German Broker Scalable Opens Investment Platform Major Ai Chatbots - https://www.reuters.com/business/finance/german-broker-scalable-opens-investment-platform-major-ai-chatbots-2026-08-25/
Best Ai Stock Screeners 2026 - https://bananafarmer.app/learn/best-ai-stock-screeners-2026
In2trading Launches Ask Desk Ai Platform Turns Stock Questions Instant - https://natlawreview.com/press-releases/in2trading-launches-ask-desk-ai-platform-turns-stock-questions-instant
Ai Investment Analytics - https://www.f6s.com/software/category/ai-investment-analytics
Ai Labs Launches Ai Powered Investment Intelligence Platform - https://www.globenewswire.com/news-release/2026/07/15/3327847/0/en/AI-Labs-Launches-AI-Powered-Investment-Intelligence-Platform-to-Bring-Advanced-Technology-Stock-Analytics-to-Retail-Investors.html
Traders Go Full Time On Prediction Markets Using Ai Bots And Antennas - https://www.cnbc.com/2026/08/01/traders-go-full-time-on-prediction-markets-using-ai-bots-and-antennas.html
Hudson River Signs Multibillion Dollar Coreweave Deal For Ai Cloud - https://www.bloomberg.com/news/articles/2026-08-20/hudson-river-signs-multibillion-dollar-coreweave-crwv-deal-for-ai-cloud
One category explained here. 200+ tools are catalogued in the FullStack Alpha directory, filterable by category, price and what they actually do.
Compare the full field → aistockpickerapps.com
Disclosure: some links on this site are affiliate links. We may earn a commission at no extra cost to you.