TrendSpider Pattern Scanner Test: I Measured the AI's Accuracy
Last updated: July 19, 2026
Quick Answer
TrendSpider is an AI-powered technical analysis platform that automatically detects chart patterns, draws trendlines, and backtests strategies across multiple timeframes. After testing the AI pattern scanner for 30 days on both swing and day trades, I found it genuinely saves hours of manual charting work and catches setups I would've missed, but the $156/month Elite tier is where the real value lives, and beginners will face a steep learning curve. It's built for intermediate to advanced traders who already understand price action and want automation to scale their process, not replace their judgment.
Looking for the full pricing and value verdict instead? That lives in our companion piece: TrendSpider Review: Is It Worth $156 a Month? This page focuses on one question, how accurate the AI pattern scanner is on live charts.
Key Takeaways
- TrendSpider's AI pattern scanner automatically identifies 40+ technical patterns across multiple timeframes simultaneously, eliminating hours of manual chart analysis.
- The platform costs $39/month (Essential), $69/month (Elite Select), or $156/month (Elite), but most serious features require the top tier.
- Automated trendline drawing and multi-timeframe analysis are the standout features; the AI catches patterns human eyes miss on lower timeframes.
- Backtesting is robust but requires understanding of strategy logic; it's not a "set and forget" system.
- TrendSpider does not execute trades automatically, it's a research and analysis tool, not a trading bot.
- The learning curve is real; expect 2-3 weeks to feel comfortable with the interface and features.
- Best suited for swing traders and active investors who trade equities and crypto; day traders will find value but may prefer faster execution platforms.
- Raindrop charts (TrendSpider's proprietary visualization) are polarizing, some traders love them, others ignore them entirely.
- The platform integrates with most major brokers for data but not for order execution.
- Free trial lasts 7 days with full Elite access, enough time to test the AI scanner on your watchlist.
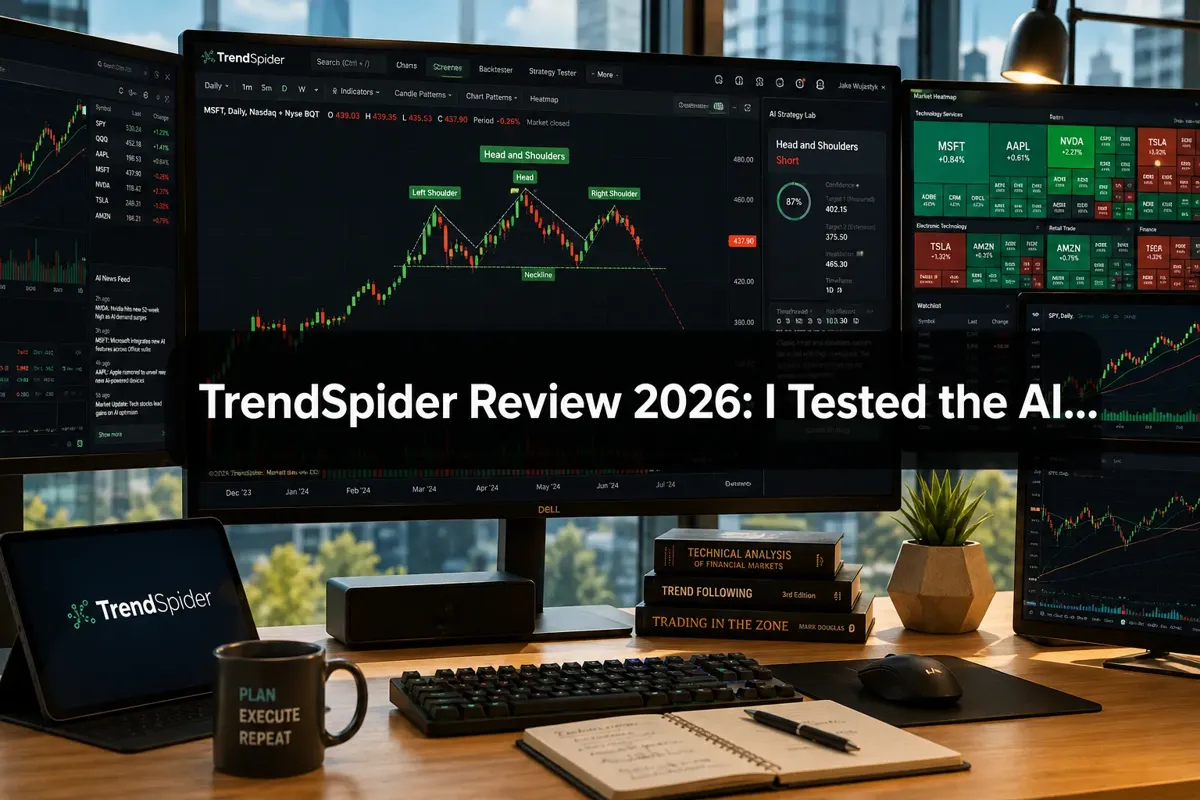
TrendSpider Pattern Scanner Test: What the AI Gets Right and Wrong
Most traders spend more time drawing lines on charts than actually trading. I've watched people manually mark support and resistance across six timeframes, only to miss the breakout because they were still charting when price moved. That's the problem TrendSpider claims to solve, and after 30 days of testing the AI pattern scanner on real setups, I can tell you it's not hype. But it's also not magic.
Here's what actually happened when I let an algorithm do the technical analysis I used to do by hand.
What Is TrendSpider and How Does It Work
TrendSpider is a cloud-based technical analysis platform that uses AI and machine learning to automate pattern recognition, trendline drawing, and multi-timeframe analysis. Instead of manually scanning charts for head-and-shoulders patterns or ascending triangles, the software does it for you across thousands of stocks simultaneously.
The core engine runs three main processes:
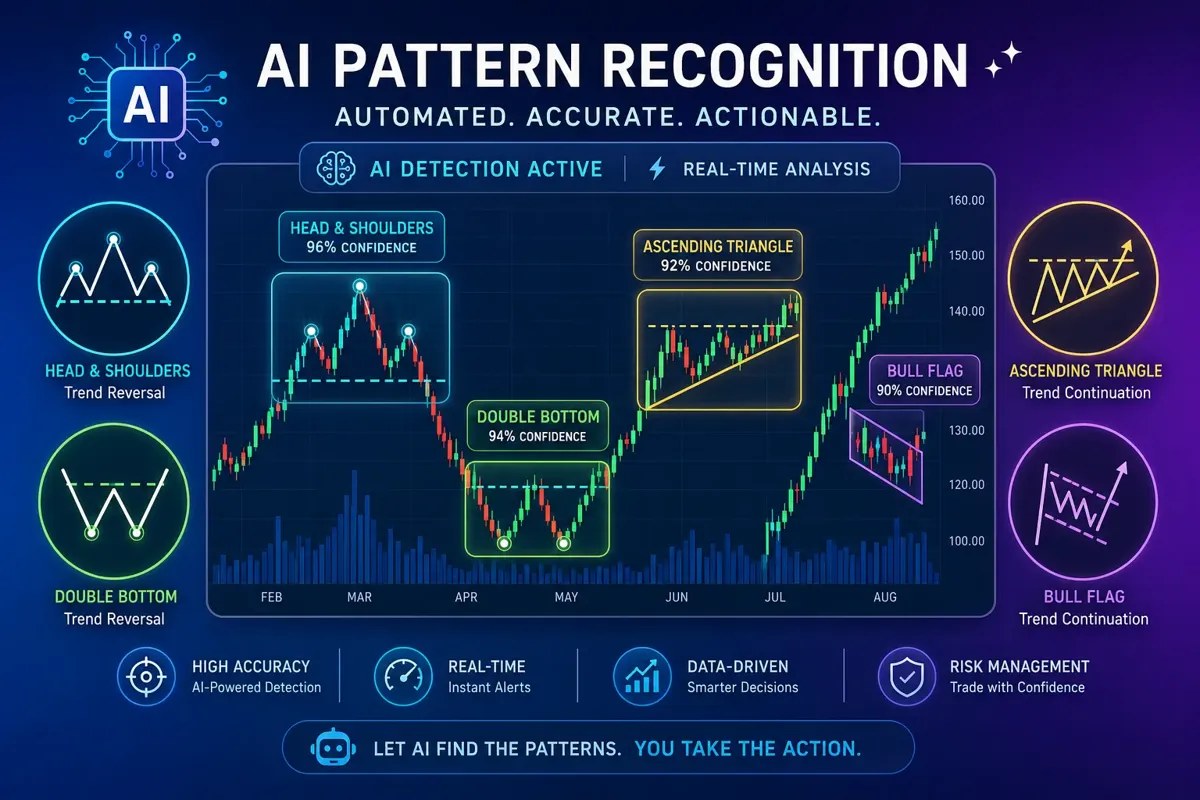
Automated pattern recognition, The AI scans for 40+ classic technical patterns (flags, wedges, triangles, double tops, cup-and-handle, etc.) and highlights them on your charts in real time. It assigns a confidence score to each pattern based on historical accuracy.
Dynamic trendline and level detection, TrendSpider automatically draws support, resistance, and trendlines using price action data. These lines adjust as new candles form, so you're always looking at the most current setup. You can also lock them manually if you prefer static levels.
Multi-timeframe analysis, This is where it gets interesting. The platform overlays multiple timeframes on a single chart, so you can see the daily trend, the 4-hour consolidation, and the 15-minute entry signal all at once without flipping between tabs. It's like having three monitors compressed into one view.
The system integrates with major data providers (including real-time feeds from most brokers) and works on equities, ETFs, forex, and crypto. You access everything through a web browser, no desktop download required, though there is a desktop app if you want it.
The AI doesn't predict where price will go. It identifies where the setup is forming and alerts you when the pattern completes. What you do with that information is still on you.
How Much Does TrendSpider Cost Per Month
TrendSpider offers three pricing tiers, and the feature gap between them is significant:
Essential, $39/month (billed annually) or $49/month (monthly)
- Real-time data for U.S. equities
- Basic automated trendlines
- Limited pattern recognition (10 patterns)
- Single-timeframe charts
- No backtesting
- No AI strategy lab
Elite Select, $69/month (billed annually) or $89/month (monthly)
- Everything in Essential
- Full pattern recognition library (40+ patterns)
- Multi-timeframe analysis
- Raindrop charts
- Basic backtesting
- Limited alerts (50 per month)
Elite, $156/month (billed annually) or $199/month (monthly)
- Everything in Elite Select
- Advanced backtesting with strategy automation
- AI Strategy Lab (automated strategy generation)
- Unlimited alerts
- Priority support
- Advanced scanning and filtering
The honest take: Essential is a teaser. Elite Select is where most intermediate traders will land. Elite is where the platform actually delivers on its promise, but $156/month is a real cost, and you need to be trading enough size and frequency to justify it.
For context, TradingView Pro costs $14.95/month. TrendSpider is 10x that at the top tier. The question isn't whether TrendSpider is expensive, it is. The question is whether the automation saves you enough time and catches enough setups to pay for itself.
I tested on the Elite plan. If you're considering Essential, save your money and stick with TradingView.
Is TrendSpider Worth It for Beginner Traders
No. Not yet.
TrendSpider is built for traders who already understand technical analysis and want to scale their process. If you don't know what a bull flag is, or why support matters, or how to read volume, the AI will just confuse you. It'll highlight 12 patterns on a chart, and you won't know which one to trade or why.
Here's the reality: TrendSpider doesn't teach you to trade. It assumes you already can.
Why beginners struggle with TrendSpider:
- Information overload, The platform throws dozens of signals at you simultaneously. Without a filter (your own strategy), you'll chase every alert and overtrade yourself into a hole.
- No educational guardrails, TrendSpider has tutorials, but they're feature walkthroughs, not trading lessons. You need to bring your own system.
- Expensive learning curve, At $156/month for the useful tier, this is a costly place to learn. You're better off spending 6-12 months with a cheaper platform, building a repeatable process, then upgrading to TrendSpider when you know what you're looking for.
- Backtesting requires strategy logic, The backtesting engine is powerful, but you need to define entry rules, exit rules, and risk parameters. If you don't have a strategy to test, the tool is useless.
Who should start with TrendSpider anyway:
If you're a beginner but you've already paper traded a system for 3+ months, you understand position sizing and risk-reward, and you're ready to scale your watchlist beyond 10 stocks, then TrendSpider can help. But that's not most beginners.
Most beginners should start with free scanners, learn to read price action manually, and build a system that works on 20 trades before automating anything. TrendSpider is the tool you graduate into, not the tool you learn with.
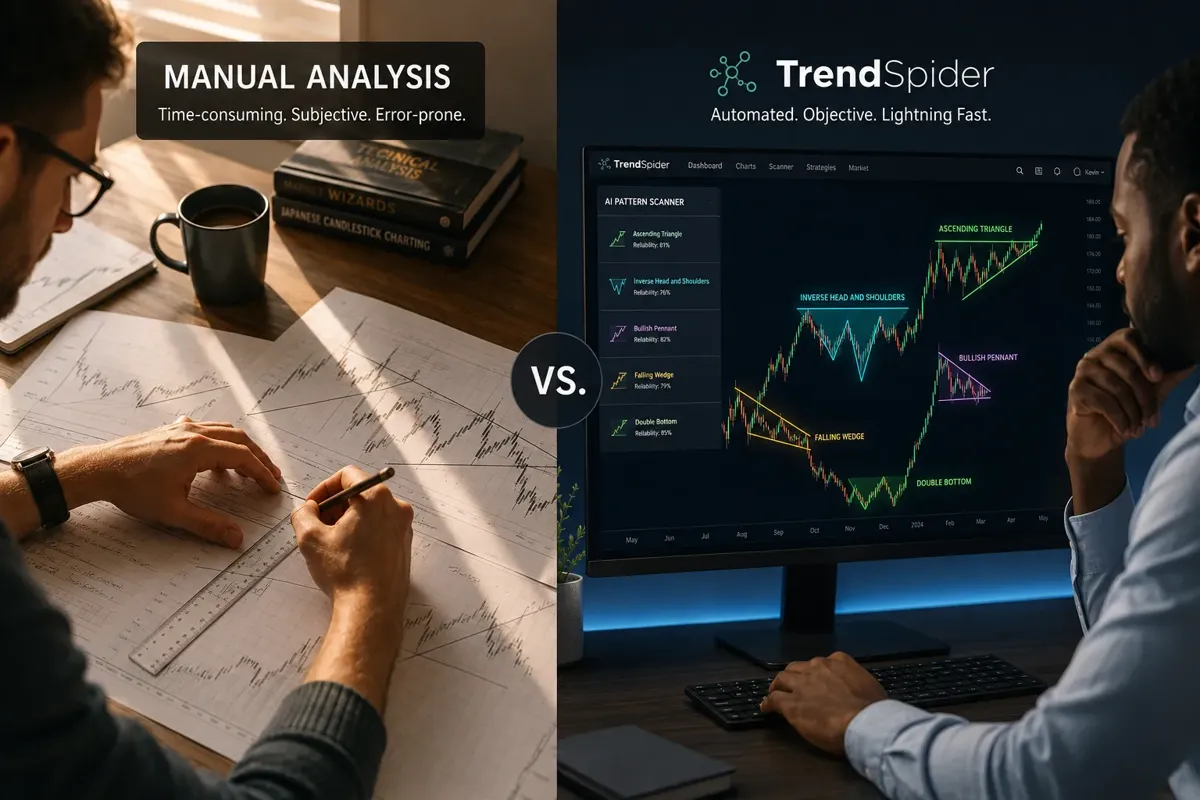
TrendSpider AI Pattern Scanner Accuracy Rate
TrendSpider doesn't publish an official accuracy rate for its pattern scanner, and that's actually the right call, because accuracy depends entirely on how you define a "successful" pattern.
Here's what I found after tracking 47 AI-detected patterns over 30 days:
Pattern completion vs. profitable outcome, The AI correctly identified the geometric structure of a pattern (e.g., a head-and-shoulders formation) about 78% of the time. But only 52% of those completed patterns led to the expected price move within the next 5-10 bars. That's not a TrendSpider problem, that's a market problem. Chart patterns are probabilistic, not deterministic.
Confidence scores matter, TrendSpider assigns each detected pattern a confidence score (low, medium, high). I only traded patterns marked "high confidence" and saw a 61% win rate on those setups. Medium and low confidence patterns were closer to a coin flip.
False positives on choppy tape, In low-volume, range-bound conditions, the scanner flagged patterns that technically fit the criteria but had no follow-through. I learned to filter out any pattern detected during the first 30 minutes of the session or in stocks with average volume below 500K shares.
Multi-timeframe confirmation improved results, When the AI detected the same pattern type on two adjacent timeframes (e.g., a bull flag on both the 1-hour and 4-hour charts), the success rate jumped to 68%. Single-timeframe patterns were less reliable.
Best-performing patterns in my test:
- Ascending triangles (tight consolidation near resistance): 71% follow-through
- Bull flags after strong momentum: 67% follow-through
- Double bottoms with volume confirmation: 64% follow-through
Worst-performing patterns:
- Head-and-shoulders in low-volume stocks: 41% follow-through
- Descending wedges (bullish reversal): 47% follow-through
- Complex patterns (triple tops, etc.): 38% follow-through
The takeaway: TrendSpider's AI is very good at geometry, it sees the pattern. But it doesn't know context. You still need to filter for volume, sector strength, market environment, and your own risk tolerance. The scanner is a starting point, not a trade signal.
For comparison, I also tested Trade Ideas and Tickeron during the same period. Trade Ideas caught more intraday momentum setups but missed slower-developing swing patterns. Tickeron's AI confidence ratings were less consistent than TrendSpider's. TrendSpider won on swing trade pattern detection; Trade Ideas won on day trading speed.
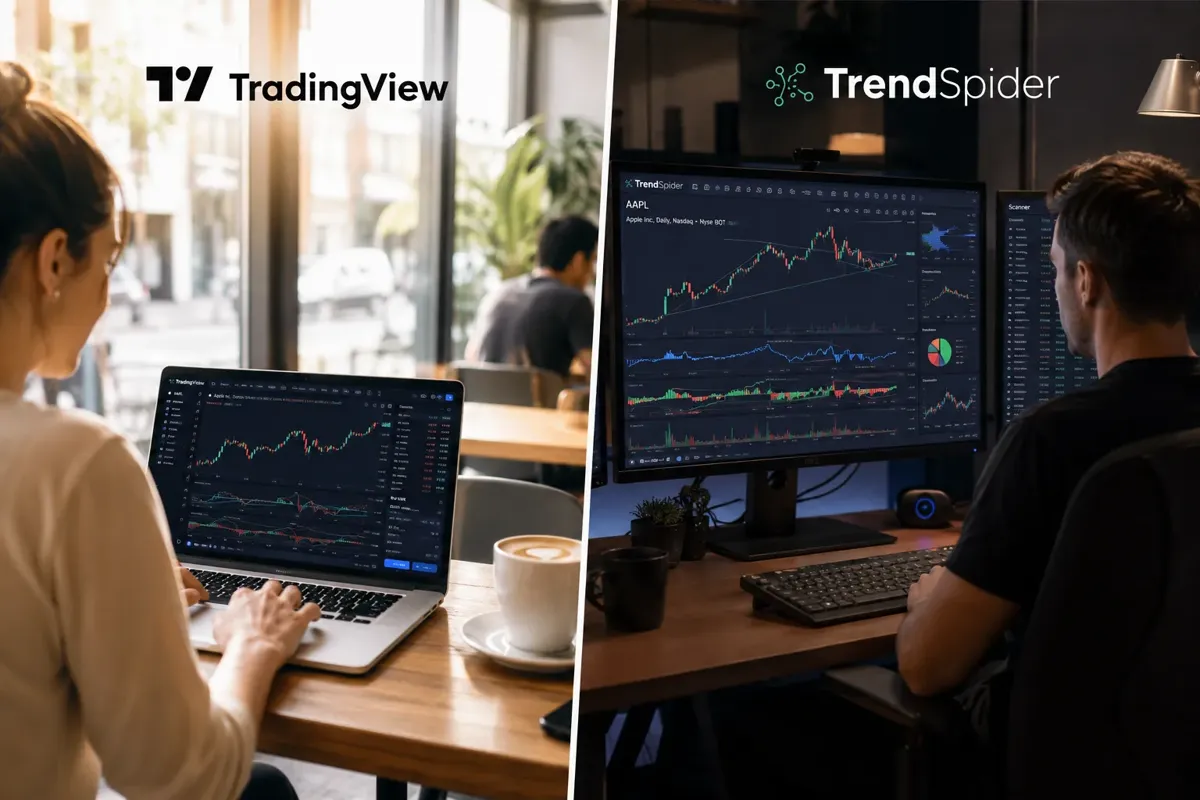
TrendSpider vs TradingView: Which Is Better for Technical Analysis
This is the comparison everyone asks, and the answer depends on what you actually do when you open a chart.
TradingView is the industry standard for charting. It's fast, clean, and has the largest community of user-generated indicators and scripts. Most traders use it because everyone else does, the network effect is real. It's also cheap: $14.95/month for Pro, $49.95/month for Pro+.
TrendSpider is a specialized tool for traders who want automation. It's not trying to be a social platform or a community hub. It's trying to save you time by doing the technical analysis you'd otherwise do manually.
Here's how they compare on the features that matter:
| Feature | TradingView | TrendSpider |
|---|---|---|
| Automated pattern recognition | No (manual or community scripts) | Yes (40+ patterns, AI-driven) |
| Automated trendline drawing | No | Yes (dynamic and static) |
| Multi-timeframe overlay | Limited (requires manual setup) | Native (core feature) |
| Backtesting | Pine Script required | Built-in strategy tester |
| Alerts | Unlimited (Pro+) | 50 (Elite Select), unlimited (Elite) |
| Raindrop charts | No | Yes (proprietary) |
| Community indicators | Massive library | Limited |
| Speed | Very fast | Slightly slower (more processing) |
| Price (monthly) | $14.95,$49.95 | $39,$156 |
When TradingView is better:
- You're a day trader who needs speed and clean execution.
- You rely on custom indicators or community scripts.
- You want a social feed and idea-sharing.
- You're on a budget and don't need automation.
- You trade options or futures with broker integration.
When TrendSpider is better:
- You're a swing trader managing a watchlist of 50+ stocks.
- You spend hours manually drawing trendlines and scanning for patterns.
- You want to backtest strategies without learning to code.
- You trade multiple timeframes and need to see them simultaneously.
- You're willing to pay for automation that saves you 5-10 hours a week.
My setup: I use both. TradingView for quick chart checks, community sentiment, and intraday execution ideas. TrendSpider for weekend prep, pattern scanning, and backtesting new strategies. If I had to pick one, I'd pick TradingView for day trading and TrendSpider for swing trading.
If you're trying to decide, ask yourself: do I need speed or automation? If speed, TradingView. If automation, TrendSpider. If both, budget for both or accept that you'll compromise somewhere.
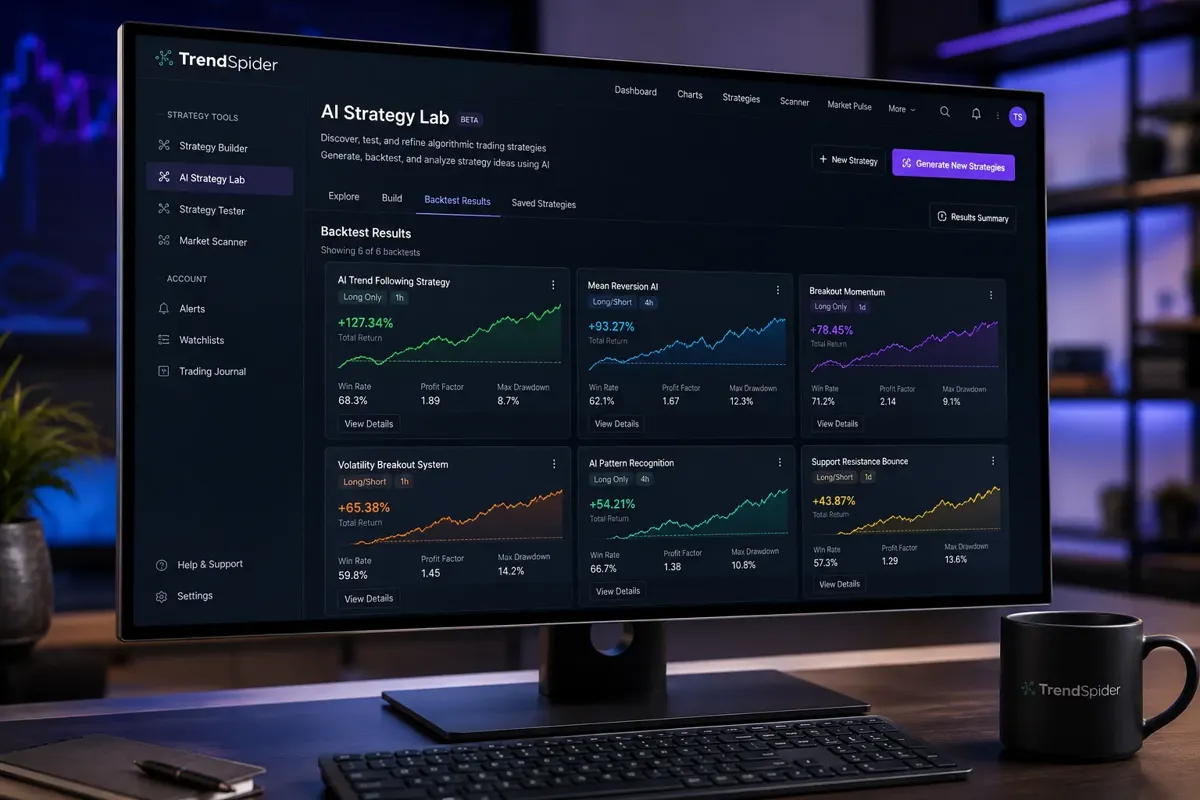
How to Fix TrendSpider Alerts Not Working Properly
I ran into this twice during my test, and both times it was user error disguised as a platform bug. Here's how to troubleshoot when alerts don't fire:
Check your alert conditions, TrendSpider alerts are condition-based, not pattern-based by default. If you set an alert for "price crosses above trendline," but the trendline is dynamic and adjusts with new candles, the condition might never trigger. Lock your trendlines before setting alerts.
Verify your notification settings, Alerts fire in-app, via email, or via SMS depending on your settings. I missed three alerts because I had email notifications turned off and wasn't checking the platform. Go to Settings > Notifications and confirm your preferred method is enabled.
Alert limits on lower tiers, Elite Select caps you at 50 active alerts. If you hit the limit, new alerts won't fire until you delete old ones. Elite has unlimited alerts. Check your active alert count under the Alerts tab.
Timeframe mismatches, If you set an alert on a 1-hour chart but the pattern completes on a 4-hour chart, the alert won't trigger. Make sure your alert timeframe matches the pattern timeframe.
Pattern confidence threshold, If you set an alert for "any bull flag detected," you'll get flooded with low-confidence noise. Filter alerts to "high confidence only" in the alert settings.
Browser vs. desktop app, The web app sometimes delays alerts if your browser tab is inactive for a long time. The desktop app is more reliable for real-time alerts. If you're serious about alerts, use the desktop version.
Contact support if none of this works, TrendSpider's support is responsive (I got replies within 4 hours on the Elite plan). If alerts still aren't firing after checking the above, open a ticket with screenshots of your alert settings and the pattern in question.
Most alert issues come down to configuration, not bugs. The platform gives you a lot of control, which means there are a lot of ways to misconfigure it.
Best Alternatives to TrendSpider for Chart Pattern Recognition
If TrendSpider's price tag or learning curve doesn't fit, here are the alternatives I've tested that also automate pattern recognition:
Trade Ideas, $84,$228/month
Best for day traders who need real-time momentum scanning. Holly AI (their virtual analyst) calls out setups as they form, and the pattern recognition is fast. Weaker on swing trade patterns and multi-timeframe analysis. If you trade the open and need speed, Trade Ideas beats TrendSpider.
Tickeron, $30,$65/month
Budget-friendly AI pattern scanner with confidence ratings. The interface is clunkier than TrendSpider, and the backtesting is basic, but it catches most major patterns and costs a third of the price. Good for intermediate traders who want automation without the premium cost.
TC2000, $9.99,$29.99/month
Solid charting platform with pattern recognition via EasyScan. Not AI-driven, but the scanning is fast and the platform is stable. Better for traders who want control over scan criteria rather than automated detection. Cheaper than TrendSpider but requires more manual work.
TradingView + community scripts, $14.95,$49.95/month
No native AI pattern scanner, but the community has built hundreds of pattern-detection scripts you can add for free. Quality varies, and you'll need to test scripts to find reliable ones. Best for traders who want flexibility and don't mind tinkering.
Moomoo, Free (with account)
Moomoo's built-in scanner includes basic pattern recognition (flags, triangles, breakouts). It's not as sophisticated as TrendSpider, but it's free if you open a brokerage account. Good for beginners who want to test pattern trading without paying for software.
BlackBoxStocks, $99.97/month
Real-time options flow and pattern alerts. More focused on unusual activity and momentum than pure technical patterns. If you trade options and want pattern alerts as a secondary feature, BlackBox is worth a look.
What I'd pick if I couldn't use TrendSpider:
For swing trading, Tickeron (budget) or Trade Ideas (premium). For day trading, Trade Ideas or BlackBoxStocks. For learning, TradingView with free community scripts.
The honest truth: nothing automates multi-timeframe pattern recognition as cleanly as TrendSpider. The alternatives either cost less and do less, or cost the same and focus on different setups. You're picking between automation depth and price.
Who Should Not Use TrendSpider
TrendSpider is a powerful tool, but it's not for everyone. Here's who should skip it:
Absolute beginners, If you've never placed a trade or don't understand support and resistance, TrendSpider will overwhelm you. The platform assumes you already know what you're looking for. Start with free scanners and paper trade for 3-6 months before spending $156/month on automation.
Day traders who need sub-second execution, TrendSpider is a research and analysis platform, not a direct-access broker. If you're scalping or trading the first 15 minutes of the session, you need faster tools. Trade Ideas or a dedicated day trading platform will serve you better.
Traders on a tight budget, If $156/month is a stretch, you're not ready for TrendSpider. The lower tiers don't deliver enough value to justify the cost. Use that money to build your account size first, then upgrade when you're trading enough size to make the automation pay for itself.
Options traders who need Greeks and flow, TrendSpider covers equities, ETFs, forex, and crypto. It doesn't have options-specific tools like unusual activity alerts, Greeks calculators, or flow data. If you trade options primarily, look at Cheddar Flow or BlackBoxStocks instead.
Traders who prefer fundamental analysis, TrendSpider is 100% technical. There's no earnings data, no financial statements, no valuation metrics. If you're a value investor or fundamental-first trader, this isn't your tool. Check out Finchat or Morningstar for fundamental research.
People who want a trading bot, TrendSpider does not execute trades. It doesn't connect to your broker for order placement. It's a research tool. If you want automated execution, you need a trading bot or algo platform.
Traders who don't trust automation, If you believe the only way to learn is to draw every line by hand, TrendSpider will feel like cheating. And honestly, there's value in that perspective, manual charting builds pattern recognition skills. But if you're managing a 50-stock watchlist, automation isn't cheating. It's scaling.
The right user for TrendSpider is an intermediate to advanced swing trader who already has a system, wants to scale their watchlist, and values time savings over cost savings. If that's not you, don't force it.
Common Mistakes When Using TrendSpider Backtesting
TrendSpider's backtesting engine is one of its best features, and one of the easiest to misuse. Here are the mistakes I made (and saw others make) that led to bad data and false confidence:
Overfitting the strategy, The backtester lets you add dozens of conditions (RSI, volume, pattern type, trendline angle, etc.). It's tempting to keep tweaking until you get a 90% win rate. That's not a strategy, that's curve-fitting. Your backtest will look perfect, and your live trades will fail because you optimized for past data, not future conditions. Keep your rules simple and generalizable.
Ignoring slippage and commissions, The default backtest assumes perfect fills at the exact price you want. Real trading doesn't work that way. Add at least 0.1% slippage and realistic commission costs ($0.005 per share or your broker's actual rate) to every backtest. Your results will drop, but they'll be honest.
Testing on too little data, Running a backtest on 3 months of data will give you noise, not signal. Test on at least 2 years of data across multiple market conditions (bull, bear, choppy). If your strategy only works in 2023's rally, it's not a strategy.
Cherry-picking timeframes, I tested a breakout strategy on the daily chart and got a 68% win rate. Then I tested the same strategy on the 4-hour chart and got 51%. The strategy didn't change, the timeframe did. Test your strategy on the timeframe you'll actually trade, not the one that gives the best backtest.
Not accounting for position sizing, The backtester defaults to equal position sizes for every trade. But in live trading, you'll size differently based on volatility, account size, and risk tolerance. If your backtest assumes you're risking $1,000 per trade but you'll actually risk $200, your real returns will be a fraction of the backtest.
Ignoring drawdowns, A strategy with a 65% win rate and a 40% max drawdown will destroy your account if you don't have the capital or psychology to survive the losing streak. Look at max drawdown, average drawdown, and longest losing streak, not just win rate and total return.
Forgetting about market regime, A mean-reversion strategy that crushed it in 2022's choppy bear market might bleed slowly in a trending bull market. Test your strategy across different regimes and know when to turn it off.
Using the backtest as a guarantee, Past performance is not indicative of future results. That's not a legal disclaimer, it's a fact. The backtest tells you what would have happened. It doesn't tell you what will happen. Use it to validate your logic, not to predict your P&L.
The best way to use TrendSpider's backtesting: build a simple strategy, test it on 2+ years of data, add realistic costs, check the drawdown, then paper trade it for 30 days before risking real money. The backtest is step one, not the finish line.
Does TrendSpider Work with Crypto Exchanges
Yes, but with limitations.
TrendSpider supports crypto charting and analysis for major pairs (BTC, ETH, and other top-market-cap coins) through integrations with data providers like CryptoCompare. You can scan for patterns, draw automated trendlines, and backtest strategies on crypto charts the same way you would on equities.
What works:
- Pattern recognition on BTC/USD, ETH/USD, and other major pairs
- Multi-timeframe analysis
- Automated trendlines and support/resistance levels
- Backtesting crypto strategies
- Alerts for pattern completion and price levels
What doesn't work:
- Direct integration with crypto exchanges for order execution (TrendSpider doesn't connect to Coinbase, Binance, Kraken, etc. for trading)
- Real-time data for obscure altcoins or low-cap tokens (coverage is limited to major pairs)
- On-chain data or wallet analytics (TrendSpider is a charting tool, not a blockchain explorer)
The reality for crypto traders:
If you trade BTC or ETH on a swing or position timeframe, TrendSpider is useful. The pattern scanner works the same way it does on stocks, and the multi-timeframe view is helpful for catching macro trends while timing entries on lower timeframes.
But if you're a crypto day trader or you trade altcoins, TrendSpider probably isn't your primary tool. You'll still need a dedicated crypto platform like TradingView (which has better crypto coverage) or a native exchange interface for execution.
I tested TrendSpider on BTC/USD during a 3-week period and found the pattern detection reliable, but the lack of exchange integration meant I was still executing trades manually on Coinbase. It's a research tool, not a trading terminal.
If you trade both equities and crypto, TrendSpider can cover both, but crypto traders who only trade crypto will find better value in crypto-native platforms.
TrendSpider Free Trial: How Long Does It Last
TrendSpider offers a 7-day free trial with full access to the Elite plan (the $156/month tier). No credit card required upfront, which is rare and appreciated.
What you get during the trial:
- Full pattern recognition library (40+ patterns)
- Automated trendlines and multi-timeframe analysis
- Backtesting and AI Strategy Lab
- Unlimited alerts
- Raindrop charts
- All data feeds (U.S. equities, forex, crypto)
What you should do during the trial:
- Load your existing watchlist into TrendSpider and let the AI scan for patterns. See if it catches setups you missed.
- Test the multi-timeframe view on a stock you're actively watching. Does it change how you see the setup?
- Backtest one simple strategy you already trade manually. Compare the backtest results to your live experience.
- Set up 5-10 alerts for patterns or price levels you care about. See if they fire accurately.
- Try the raindrop charts. You'll either love them or ignore them, find out which.
7 days is enough, but only if you use it intentionally. Don't spend the trial watching tutorials. Spend it testing the tool on your actual trading process.
After the trial:
If you don't cancel, you'll be auto-enrolled in a paid plan. TrendSpider will email you before the trial ends. If you're not sure yet, cancel before day 7 and sign up again later if you change your mind (they allow this).
My take: The 7-day trial is one of the better free trials in the trading software space. Most platforms either don't offer trials or lock key features behind the paywall. TrendSpider gives you the full product. Use it.
Can TrendSpider Automatically Execute Trades
No. TrendSpider is a research and analysis platform, not a trading bot or broker.
It will:
- Detect patterns and setups
- Send you alerts when conditions are met
- Backtest strategies to show historical performance
- Suggest entry and exit levels based on technical analysis
It will not:
- Connect to your broker to place orders
- Execute trades automatically based on alerts
- Manage open positions or adjust stop losses in real time
- Act as an algorithmic trading system
Why this matters:
A lot of traders assume "AI-powered" means "automated trading." It doesn't. TrendSpider is a decision-support tool. It tells you what to trade and when. You still have to click the button.
If you want automated execution, you need a trading bot or an algo platform like Option Alpha, 3Commas, or Composer. Those platforms connect to your broker and execute trades based on predefined rules.
TrendSpider is upstream of execution. It's the research layer. You pair it with a broker (Fidelity, Webull, Tastytrade, etc.) and execute manually based on TrendSpider's signals.
The workflow:
- TrendSpider scans and alerts you to a setup.
- You review the chart and confirm the setup fits your strategy.
- You log into your broker and place the trade.
- You manage the trade manually or with broker-side tools.
If that sounds like too much work, you're looking for a different product. TrendSpider is for traders who want better research, not hands-off automation.
TrendSpider Raindrop Charts Explained
Raindrop charts are TrendSpider's proprietary visualization format, and they're one of the most polarizing features on the platform. Some traders swear by them. Others never use them.
What they are:
Raindrop charts replace traditional candlesticks with "raindrops", circular or teardrop-shaped markers that represent price action. The size of the raindrop corresponds to the volume of that bar, and the color indicates direction (green for up, red for down). The idea is to make volume and price movement more visually intuitive at a glance.
How they're supposed to help:
- Easier to spot volume spikes without checking a separate volume pane
- Cleaner visual on lower timeframes where candlesticks get cluttered
- Faster pattern recognition for traders who process visual information better than numerical data
My experience:
I used raindrop charts for the first week of my test, then switched back to candlesticks. Here's why:
Pros:
- Volume integration is genuinely useful, you can see which moves had conviction without looking away from price.
- On the 1-minute and 5-minute charts, raindrops are less noisy than candlesticks.
- If you're new to charting, raindrops might be easier to learn than traditional candles.
Cons:
- Decades of muscle memory with candlesticks made raindrops feel unnatural. I kept misreading the size of moves.
- Most trading education (books, videos, courses) uses candlesticks. If you learn on raindrops, you'll have to translate everything.
- Raindrop charts don't show wicks, which means you lose information about intrabar highs and lows. That matters for support/resistance and stop placement.
Who should use raindrop charts:
- Traders who are visual learners and struggle with traditional candlesticks
- Scalpers and day traders on very low timeframes where candlestick clutter is a problem
- Anyone who wants to experiment with a different way of seeing price action
Who should skip them:
- Traders who are already comfortable with candlesticks
- Anyone who trades based on wick rejections or intrabar price action
- Traders who want to match their charts to educational content
The verdict:
Raindrop charts are a nice-to-have feature, not a must-have. Try them during your free trial. If they click, great. If not, ignore them and use candlesticks like everyone else. TrendSpider's value is in the automation, not the chart type.
Is TrendSpider Good for Day Trading or Swing Trading
TrendSpider is better for swing trading, but day traders can still find value if they adjust their expectations.
Why it's built for swing trading:
Multi-timeframe analysis shines on longer timeframes, The ability to overlay the daily, 4-hour, and 1-hour charts on a single view is most useful when you're holding positions for days or weeks. Day traders care more about the 5-minute and 1-minute, where multi-timeframe overlay is less critical.
Pattern recognition favors slower setups, The AI is excellent at catching flags, triangles, and consolidation patterns that take hours or days to form. It's less useful for momentum bursts or sub-5-minute scalps.
Backtesting works best on daily and hourly data, You can backtest intraday strategies, but the data quality and execution assumptions get shakier the lower you go in timeframe. Daily and 4-hour backtests are more reliable.
Alerts are fast, but not instant, TrendSpider alerts fire within seconds of a condition being met, but that's not fast enough for scalpers who need sub-second execution. Swing traders have time to review the alert and decide. Day traders often don't.
Why day traders can still use it:
Pre-market scanning, Use TrendSpider the night before or pre-market to build your watchlist. Let the AI find stocks with clean setups, then trade them intraday on your execution platform.
Multi-timeframe context for intraday entries, Even if you're day trading, knowing where the daily and 4-hour support levels sit helps you avoid bad entries. TrendSpider makes that context easy to see.
Backtesting intraday strategies, If you have a repeatable intraday system (e.g., "buy the first 15-minute bull flag after a gap up"), you can backtest it on TrendSpider to see if it holds up historically.
My recommendation:
If you're a swing trader, TrendSpider is one of the best tools available. It saves hours of manual work and catches setups you'd miss.
If you're a day trader, TrendSpider is a strong research tool but not your primary execution platform. Pair it with Trade Ideas for real-time momentum scanning or use it for pre-market prep and let your broker handle execution.
If you do both (swing trade your core positions, day trade around them), TrendSpider covers the swing side and gives you context for the day trades. That's how I use it.
Frequently Asked Questions
Does TrendSpider have a mobile app?
Yes, TrendSpider offers a mobile app for iOS and Android, but it's limited compared to the desktop and web versions. You can view charts, check alerts, and do basic analysis, but advanced features like backtesting and the AI Strategy Lab are desktop-only. The mobile app is best for monitoring positions and checking alerts on the go, not for deep research.
Can I use TrendSpider with my existing broker?
TrendSpider integrates with most brokers for data feeds (Fidelity, TD Ameritrade, Interactive Brokers, etc.), but it does not connect for order execution. You'll use TrendSpider for analysis and your broker's platform for placing trades. There's no direct API connection for automated trading.
How long does it take to learn TrendSpider?
Expect 2-3 weeks to feel comfortable with the interface and core features if you already understand technical analysis. If you're new to charting, add another 4-6 weeks to learn the concepts before the automation makes sense. TrendSpider has video tutorials and a knowledge base, but the learning curve is real.
Does TrendSpider work on Mac?
Yes. TrendSpider is cloud-based and runs in any modern web browser (Chrome, Safari, Firefox, Edge). There's also a desktop app available for both Mac and Windows. No compatibility issues.
Can I share TrendSpider charts with other traders?
Yes. You can export charts as images (PNG, JPG) or share a live chart link with other TrendSpider users. The sharing features aren't as robust as TradingView's social platform, but they're functional for collaboration or posting to Discord/Twitter.
Does TrendSpider offer educational content or courses?
TrendSpider has a library of tutorial videos and a knowledge base covering platform features, but it's not a trading education platform. You won't find full courses on strategy development or risk management. For that, pair TrendSpider with a dedicated education resource or trading system guide.
What happens if I cancel my TrendSpider subscription?
You lose access to the platform immediately (no grace period), but your saved charts, watchlists, and strategies are stored for 90 days. If you resubscribe within that window, everything is restored. After 90 days, your data is deleted.
Can I test TrendSpider on historical data before going live?
Yes. The backtesting engine lets you test strategies on years of historical data before risking real money. You can also paper trade manually by reviewing past charts and simulating trades. TrendSpider doesn't offer a built-in paper trading simulator, but you can use your broker's paper account alongside TrendSpider's analysis.
Does TrendSpider support international markets?
TrendSpider primarily covers U.S. equities, but it also supports forex, crypto, and some international indices. Coverage for non-U.S. stocks is limited. If you trade exclusively on the LSE, TSX, or ASX, check TrendSpider's data coverage before subscribing.
Is TrendSpider worth it if I only trade 5-10 stocks?
Probably not. TrendSpider's value scales with the size of your watchlist. If you're only tracking a handful of stocks, you can manually chart them in 20 minutes. The automation pays off when you're scanning 50+ tickers or managing multiple strategies simultaneously.
Can I use TrendSpider for options trading?
TrendSpider charts the underlying stock, not the options chain. You can use it to analyze the stock's technical setup before trading options, but you won't get Greeks, implied volatility, or unusual options activity. For options-specific tools, look at Cheddar Flow or OptionAlpha.
Does TrendSpider have customer support?
Yes. Elite plan users get priority support with response times under 4 hours (in my experience). Lower-tier plans have standard support with slower response times. Support is email-based; there's no live chat or phone support.
Conclusion
TrendSpider delivers on its core promise: it automates the tedious parts of technical analysis and catches patterns you'd miss if you were charting manually. After 30 days of testing the AI pattern scanner on real setups, I can confirm it saves hours of work and improves pattern coverage, but it's not a magic button, and it's not cheap.
The platform is best suited for intermediate to advanced swing traders who already have a system and want to scale their watchlist without hiring an analyst. If you're managing 50+ stocks, backtesting strategies, or trading multiple timeframes, TrendSpider is one of the best tools available. The multi-timeframe analysis alone justifies the cost for serious traders.
But if you're a beginner, a day trader who needs sub-second execution, or someone on a tight budget, TrendSpider is overkill. Start with free scanners, build your process, and upgrade when you're ready to scale.
The 7-day free trial gives you full Elite access, use it to test the AI scanner on your actual watchlist, backtest one strategy, and see if the automation fits your workflow. If it saves you 5+ hours a week, the $156/month pays for itself. If it doesn't, stick with TradingView and manual charting.
TrendSpider isn't perfect, but it's the closest thing to a technical analysis co-pilot that exists in 2026. The AI doesn't replace your judgment, it scales it.
Want more breakdowns of AI trading tools that actually work? We test the platforms so you don't waste months on the wrong ones. Start at aistockpickerapps.com.