Gamma Exposure Explained | What GEX Can and Can't Tell You
Gamma exposure measures one thing: how many shares dealers must buy or sell to stay hedged when price moves. Not where price is going. Not when. Just how violent the ride is likely to be once it gets there.
Quick Answer
Gamma Exposure Explained | What GEX Can and Can't Tell You comes down to a single trade-off: GEX is a map of hedging pressure, not a forecast. Net GEX is the aggregate gamma held by options dealers, converted into the dollar amount of stock they need to trade per 1% move in the underlying, as laid out in SpotGamma's gamma exposure definition. Positive net GEX tends to dampen moves. Negative net GEX tends to amp them up. Every GEX number you have ever seen is an estimate built on an assumption about which side of the trade dealers are on, because nobody outside the dealers sees the real book.
Quick pick: gamma exposure data
- Barchart Plus: free-tier options chains, cheap open interest work. $9.99/mo
- Unusual Whales Retail Basic: live options flow plus GEX context. $50/mo
- SpotGamma (Robinhood Agent Apps): index-level SPX gamma levels. $10/mo
Skip it if: you hold positions for months and never watch intraday price action.
Key Takeaways
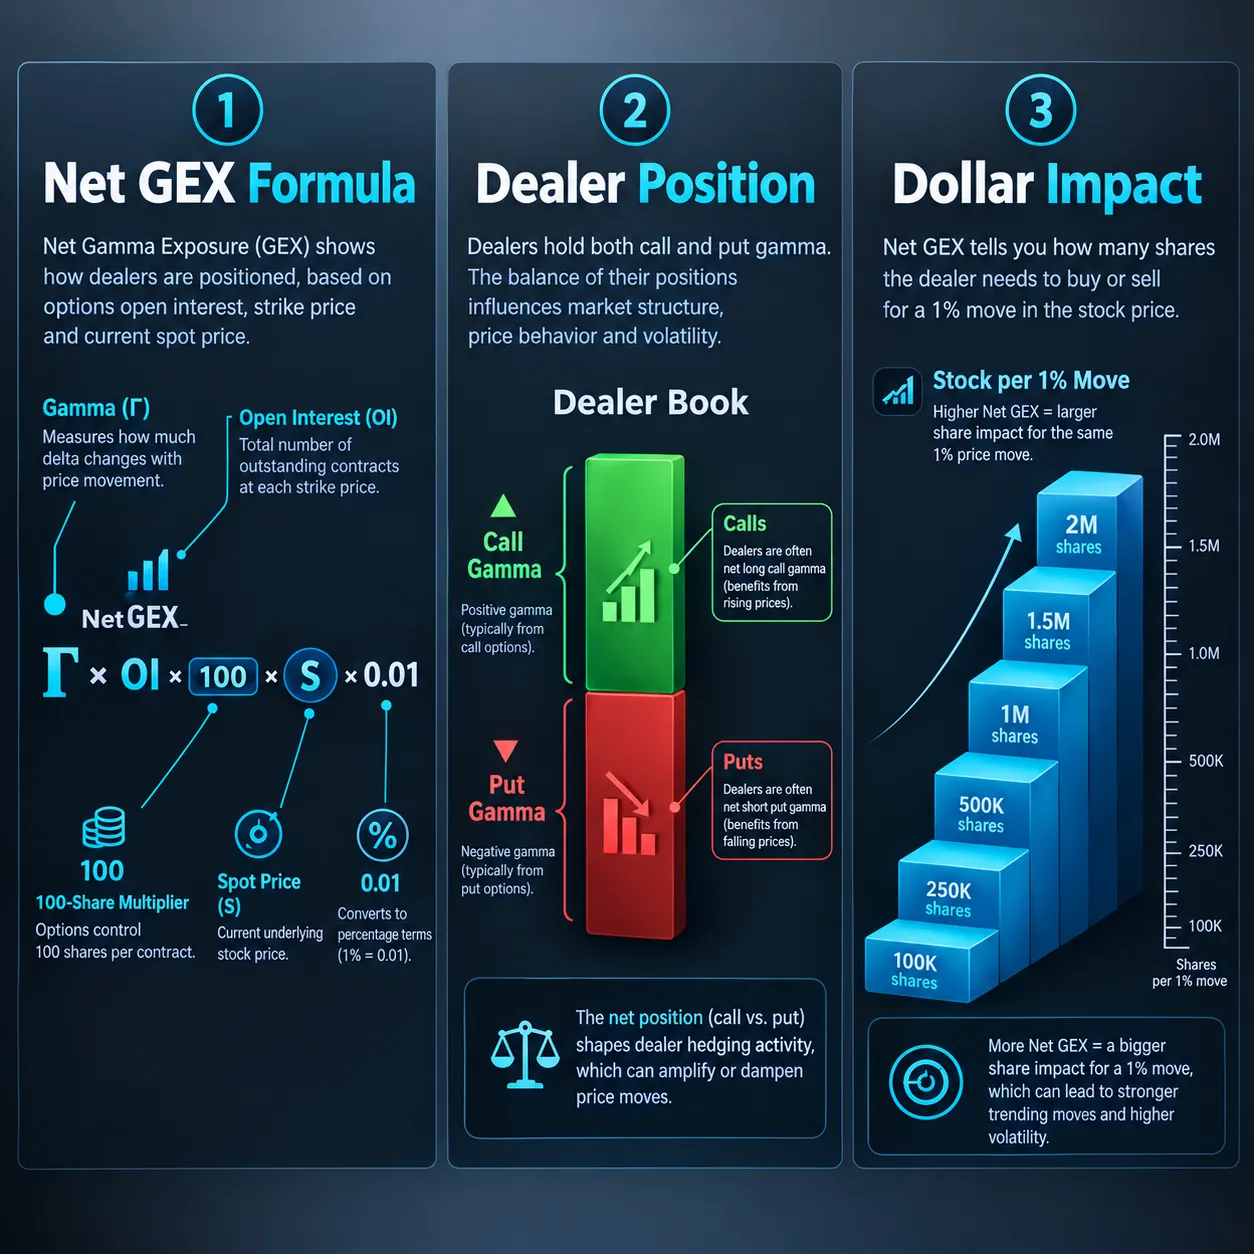
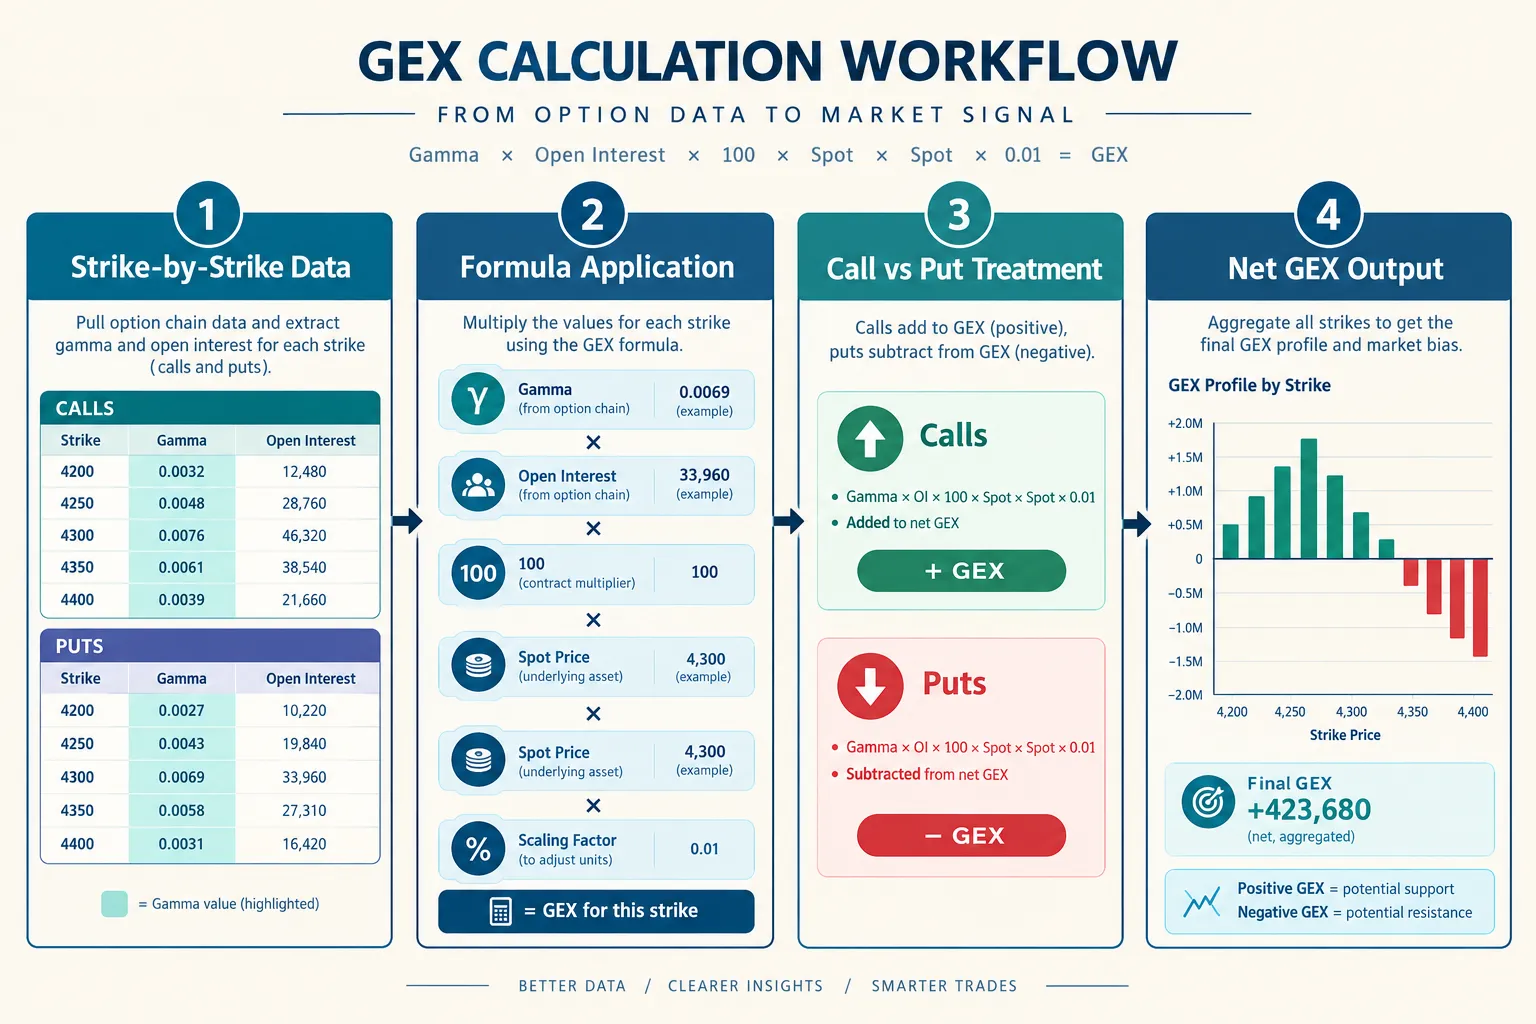
- Net GEX converts dealer gamma into dollars of stock per 1% move. The standard per-strike formula multiplies gamma by open interest by the 100-share contract multiplier by spot price, then by 0.01 for a 1% move, per InsiderFinance's GEX guide.
- Positive gamma pins, negative gamma amps. Dealers long gamma sell rallies and buy dips. Dealers short gamma do the opposite, which widens the range, as described by EBC's breakdown of GEX market effects.
- The gamma flip is where net GEX crosses zero. Above it, vol tends to compress. Below it, vol tends to expand. That one level does more work than the other 20 on the chart.
- Dealer positioning is modeled, not observed. Most public GEX assumes customers sell calls and buy puts, which leaves dealers long calls and short puts. QuantWheel's GEX overview is blunt that the sign convention is an assumption.
- It is context, not a trigger. On Reddit, u/zibudada put it best: "Short answer: it helps with context, not with entries."
- Free beats paid for most beginners. Barchart's free tier is $0 and Unusual Whales has a free plan with data delayed 2 trading days. SpotGamma also publishes free SPX gamma levels.
- You can build it yourself. u/NationalOwl9561: "it's very easy to self host your own GEX dashboard with Schwab API for free."
What is gamma exposure in plain English?
If you are asking what is gamma exposure in trading terms, here it is. Gamma exposure is the amount of stock options dealers must trade to stay market neutral as price moves. If net GEX is positive, their hedging acts like a shock absorber. If net GEX is negative, their hedging acts like an amp pedal, and the move gets louder.
Start with the two Greeks. Delta is how much an option's value changes per $1 move in the stock. Gamma is how fast delta itself changes. A dealer who sells you a call is short that option and must buy shares to offset the delta. As price rises, delta rises, so the dealer keeps buying. That mechanical buying is the whole story.
Market makers do not take a view. They quote both sides, collect the spread, and hedge the directional risk out. FlashAlpha's explainer on what gamma exposure GEX is frames GEX as the aggregate of that forced hedging across every strike and expiry on the board.
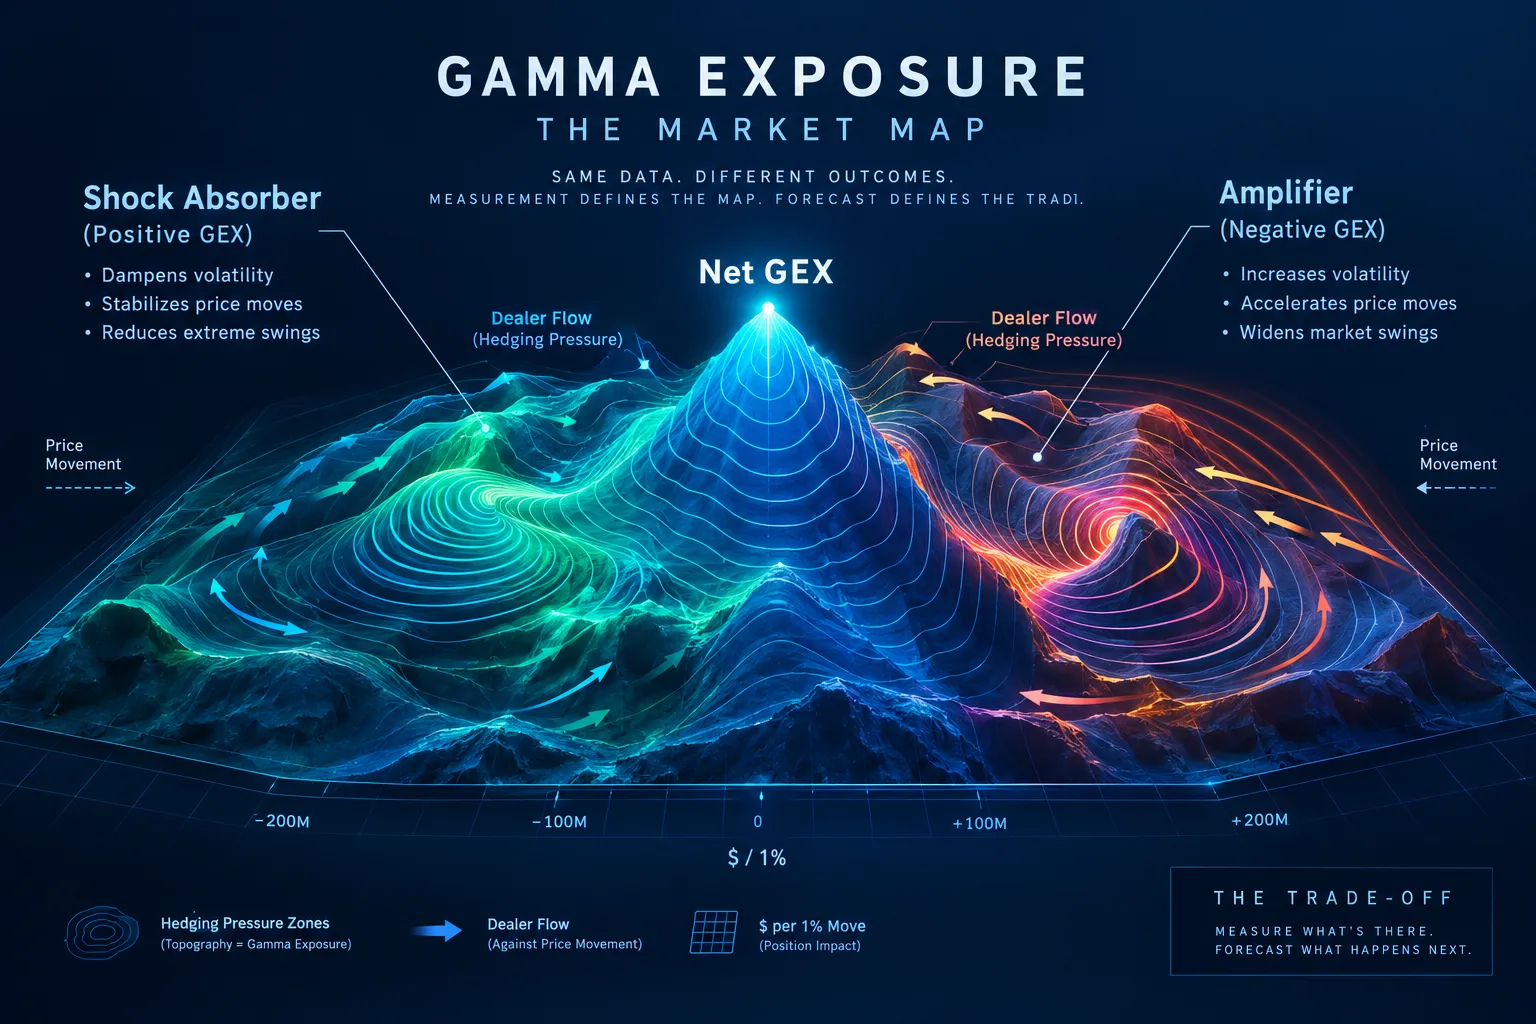
Think of it like a car with the cruise control stuck on. The driver is not choosing to accelerate. The system is just doing what the system does. GEX tells you how aggressive that system is at a given price.
Gamma exposure vs delta explained
Delta is position. Gamma is sensitivity of position. A dealer book can be delta neutral at 9:30 and carry $400 million of gamma exposure, meaning a 1% move forces roughly $400 million of hedging shares through the tape before the book is neutral again. Delta tells you where they stand. Gamma tells you how hard they have to run to stay there.
Rule of thumb: delta answers "what do they own right now," gamma answers "what will they be forced to do next." Confusing the two is the single most common beginner error with GEX gamma exposure data.
Gamma exposure: how are GEX levels calculated?
GEX levels are calculated strike by strike from settled open interest, then summed. The common formula is gamma multiplied by open interest multiplied by 100 multiplied by spot price, multiplied again by spot and by 0.01 if you want dollars per 1% move. Call gamma is added, put gamma is subtracted, under the standard dealer-positioning assumption.
Walk the math with illustrative numbers, not live ones. Say SPY sits at 600 and one strike holds 20,000 contracts of open interest with a gamma of 0.03:
- 0.03 gamma x 20,000 contracts x 100 shares = 60,000 shares of delta per $1 move.
- 60,000 shares x $600 = $36 million of notional per $1 move.
- A 1% move in SPY is $6, so roughly $216 million of hedging at that single strike.
Now repeat that for every strike on every expiry and add the signs. That sum is net GEX. Anyone searching for GEX SPY levels is looking at this exact math applied to SPY options. ZeroGEX's gamma exposure education page walks through the same per-strike construction and the sign convention that makes puts negative.
The GEX strike profile and OI strike profile
A gamma exposure strike profile plots net GEX per strike as a bar chart, positive bars up, negative bars down. An OI strike profile plots raw open interest at the same strikes with no gamma weighting. Both come from the same settled data. The strike profile is where the call wall, put wall pair shows up, and open interest analysis is what feeds it.
The important and frequently ignored detail: that settled open interest is from yesterday's close. It does not know what traded this morning. Which brings up the single biggest fork in the road.
Why open interest GEX and flow-GEX disagree
Open interest GEX uses settled contracts. Flow-GEX uses today's executed trades, tagged by whether they hit the bid or the ask, to estimate how dealer gamma has shifted since the open. FlashAlpha's GEX trading guide covering the gamma exposure API for SPY and TSLA leans on intraday flow for exactly this reason. On a heavy 0DTE day, the settled book and the flow-GEX read can point opposite directions by 11:00.
If you only ever check one, check the settled profile before the open and a flow-GEX read at midday. Two looks, 30 seconds each.
How does positive and negative gamma exposure affect price?
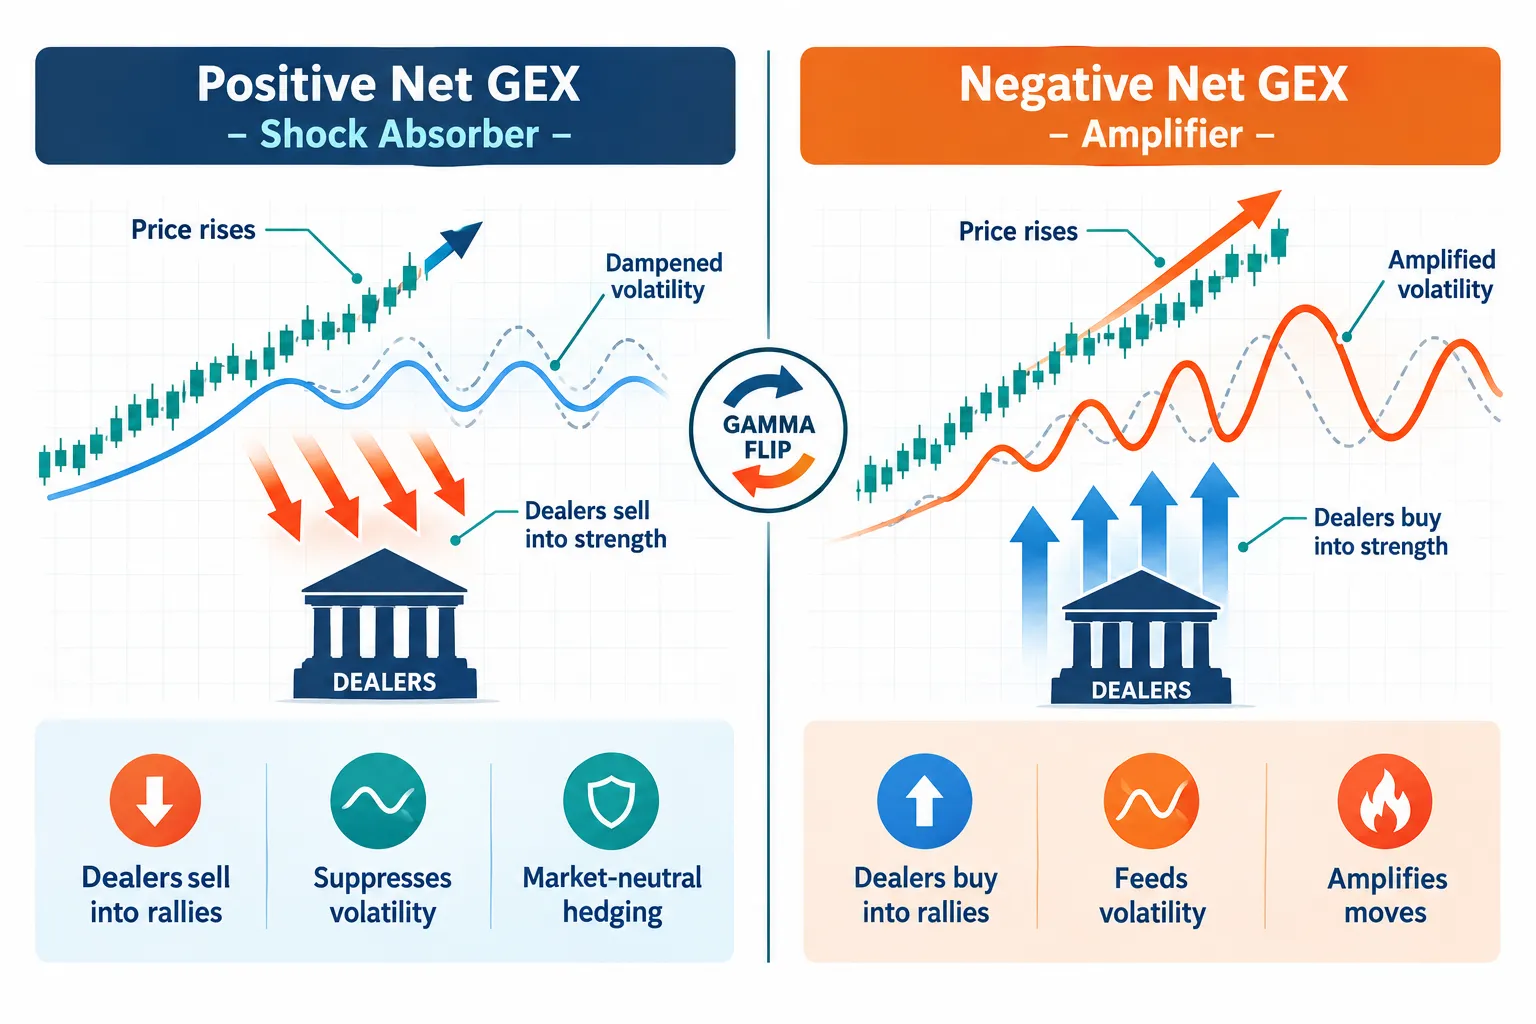
Positive net GEX suppresses realized volatility because dealer hedging trades against the move. Negative net GEX feeds realized volatility because dealer hedging trades with the move. That single sign flip explains most of why the same index can grind for six sessions and then travel 3% in 90 minutes.
Positive gamma: the pinning regime
When dealers are long gamma, they sell strength and buy weakness to stay hedged. Price gets magnetized toward heavy strikes. Ranges tighten. Breakouts fail. Traders call it pinning, and it is why a stock can sit at 450.20 all Friday afternoon while 450 holds 80,000 contracts of settled open interest.
Practical takeaway: in a positive gamma regime, mean reversion setups get the benefit of the doubt and breakout setups need extra confirmation. The tape is choppy by design, not by accident.
Negative gamma: the momentum regime
When dealers are short gamma, hedging flips to buying highs and selling lows. Every tick down forces more selling. That is the amp turned to 11. EBC's explanation of GEX and market effects describes this as the amplifying regime, and it is where gap-and-go continuation and air-pocket selloffs live.
In a negative gamma regime, trend-following works better and fading extremes gets expensive fast. Catching a falling knife is always a bad habit. In negative GEX it is an expensive one.
The gamma flip: the regime dividing line
The gamma flip is the price where net GEX crosses zero. Above the flip, positive gamma dominates and vol compresses. Below the flip, negative gamma dominates and vol expands. SpotGamma's free GEX levels page publishes this zero gamma level for the index, and it is the one number worth writing on a sticky note.
The flip is not static. It moves as open interest changes and as implied volatility shifts, because gamma concentrates differently at different vol levels. A flip level 40 points below spot at Monday's open can sit 12 points below spot by Thursday without price doing anything unusual.
What are the key GEX levels: call wall, put wall, and gamma flip?
Three levels do nearly all the work: the call wall, the put wall, and the gamma flip. The call wall is the strike with the largest positive gamma exposure, the put wall is the strike with the largest negative gamma exposure, and the flip is where net GEX hits zero.
| Level | What it marks | How traders use it |
|---|---|---|
| Call wall | Largest positive GEX strike above spot | Acts like resistance while positive gamma holds |
| Put wall | Largest negative GEX strike below spot | Acts like support, and like an accelerant if lost |
| Gamma flip | Net GEX crosses zero | Regime line between pinning and momentum |
| Gamma price profile | Net GEX recalculated across a range of spot prices | Shows where the flip sits if price travels |
The gamma price profile is the chart most retail traders skip and should not. Instead of showing GEX at today's spot, it recomputes net GEX at hypothetical prices, so you can see the flip 2% lower before you get there. SpotGamma's best gamma exposure tool comparison treats that profile view as core, not decoration.
Common mistake: treating a call wall like a hard ceiling. It is not a wall of bricks. It is a region where dealer hedging leans against price. When enough call buying rolls through, dealers re-hedge upward and the wall moves higher, which is exactly how a squeeze starts.
What do GEX heatmaps, expiry charts, and volatility skew add?
Three secondary views add real information: a GEX heatmap by expiration shows where gamma is concentrated in time, gamma exposure by expiry shows which cycle dominates, and volatility skew shows what traders are paying for downside protection. None of them generate a signal on their own.
- GEX heatmap by expiration. A grid of strike against expiry, colored by net GEX. Monthly expiries usually glow brightest because institutional positioning clusters there. Weeklies and 0DTE show up as thin, intense bands that vanish overnight.
- Gamma exposure by expiry. Collapses the heatmap into one bar per expiration. If 70% of the gamma sits in contracts expiring today, that pin dissolves at 4:00 and tomorrow is a different market.
- Volatility skew. The shape of implied volatility across strikes. Steep put skew means downside options are bid, which changes the gamma math because gamma concentrates where implied volatility is lowest relative to its neighbors.
- Intraday delta GEX. Often written as intraday ΔGEX. It is the change in net GEX since the open, which is flow-GEX in chart form. A sharp negative swing in ΔGEX while price is flat is the kind of thing worth noticing.
- Signals. Most platforms bolt alerts on top: flip crossed, call wall breached, put wall tested. Treat them as a reason to look, not a reason to click buy. The same goes for any gamma exposure indicator you bolt onto a chart.
Edge case worth knowing: on the day a large expiry rolls off, every level on your gamma exposure strike profile is about to be rebuilt from scratch. Levels that held for three weeks can stop mattering at 4:01 p.m.
Does GEX help with entries or only context?
Context, almost always. GEX tells you what kind of day it probably is and which levels the hedging flows care about. It does not tell you direction, and it has no opinion about your entry, your stop, or your position sizing.
Here is the honest division of labor:
- What GEX is good at: expected range, regime identification, picking the levels where reactions cluster, deciding whether to fade or follow.
- What GEX is bad at: entry timing, direction, anything on a stock with thin options volume, anything on a day when news overwhelms positioning.
How do market makers use gamma exposure and hedge it?
Dealers do not read a GEX dashboard. They run the real book and hedge continuously. Their hedging is the thing your dashboard is trying to reverse engineer. QuantWheel's GEX overview is clear that retail-visible GEX is an inference about that hedging, not a copy of it.
A retail GEX trading strategy generally comes down to three choices. Sell premium near a call wall in a positive gamma regime and accept that pinning may end. Buy premium below the flip when dealers short gamma are amplifying moves. Or do nothing and just use the levels to size smaller. The third one is underrated.
Gamma exposure during high volatility, and in bull versus bear markets
In a steady bull market, call buying builds positive gamma above spot, the flip sits well below price, and ranges stay tight. In a bear market, put buying builds negative gamma and the flip can sit above spot, which means the market lives in the momentum regime and stays there. During high volatility, GEX decays in usefulness because dealers widen spreads, hedge less precisely, and the open interest assumption gets shakier.
Decision rule: if the flip is more than a few percent below spot and net GEX is strongly positive, expect grind. If spot is below the flip and net GEX is negative, expect travel. Everything in between is noise.
What is a gamma squeeze, and can a screener find it?
A gamma squeeze happens when heavy call buying forces dealers to buy more and more shares as price rises, and that buying pushes price higher, which forces still more buying. A gamma squeeze screener looks for the preconditions, mainly concentrated call open interest, low float, and rising implied volatility. Screeners find candidates, not outcomes.
GameStop Corp. (GME) GEX overview and key GME GEX levels
Single-stock GEX is a different animal from index GEX. For a name like GameStop Corp. (GME), key GME GEX levels cluster around round numbers where retail call buying concentrates, and the whole profile can be rebuilt by one busy session. The 2026 GEX ecosystem expanded well past SPX into single-stock universes, which is both useful and dangerous, because a thin options chain produces confident-looking garbage.
Market maker positioning for GME is where the standard assumption tends to break. If retail is net long calls, dealers are assumed short those calls and short gamma into strength. A GME open interest summary showing one strike with several times the open interest of its neighbors is the structural setup for a squeeze. It is not a prediction of one.
How to use GEX data for trading GME, or any high-attention single stock:
- Check the open interest concentration first. One dominant strike matters more than total volume.
- Mark the call wall and the put wall. Those are your reaction zones.
- Watch implied volatility. Rising vol with rising price is the squeeze tell.
- Size for the regime, not the thesis. Low float plus negative gamma means your stop will get run.
Honest caveat: the 2021 meme-stock episodes were driven by short covering, retail flows, and media attention as much as options hedging. Crediting it all to gamma is tidy storytelling.
What can't gamma exposure tell you?
GEX cannot tell you direction, timing, or the actual dealer book. It is a model output. Three assumptions sit underneath it, and all three can be wrong at the same time.
1. The positioning assumption. Public GEX assumes dealers are long calls and short puts. Sometimes customers are the ones buying calls in size and the dealer is short them. Then your sign is backwards. There is no dealer risk classifier on any retail dashboard that can see which bank holds what.
2. The data lag. Open interest is settled overnight. Every pre-market GEX chart describes yesterday. Flow-GEX narrows the gap but adds its own guesswork about who initiated each trade.
3. The gamma estimate. Gamma comes from a pricing model fed by implied volatility inputs. Change the vol surface assumption and the gamma exposure levels move without anything happening in the market.
FlashAlpha's GEX explainer and InsiderFinance's guide both frame GEX as a risk-management and context tool rather than a directional one. That is the responsible framing. Any vendor selling GEX as a crystal ball is selling something else.
How should a beginner use GEX?
Beginners should use GEX as a daily context check and nothing more: one look at the flip level, one look at the call wall and put wall, then back to the actual setup. Spending $120 a month on gamma exposure data before you have written down your risk rules is backwards.
A workable 10-minute routine:
- Pre-market: note net GEX sign, the flip level, the call wall, the put wall. Four numbers.
- At the open: ask one question. Is spot above or below the flip?
- Positive GEX, above flip: expect range. Tighten targets. Respect the walls.
- Negative GEX, below flip: expect travel. Widen stops or trade smaller. Stop fading.
- Midday: one flow-GEX or intraday ΔGEX check to see if the morning's flow changed the picture.
- Never: take a trade whose only reason is "price is at the put wall."
How does gamma exposure affect your portfolio if you are a swing trader or investor? Mostly through timing. A positive gamma regime is a better place to add on a dip because dips get bought mechanically. Below the flip, the same dip can keep going. If you hold for months, GEX barely matters and you can skip this whole category. Our write-up on what you pay for versus what you get with AI trading software covers that math for tools generally.
Fit by style: day traders and scalpers get the most from live GEX, swing traders get mild benefit from the regime read, long-term investors get essentially nothing. If you want the directional signal rather than the structure, you want what options flow actually is instead.
Which gamma exposure tool should you actually pay for?
There is no single best GEX tool, because index GEX, single-stock GEX, and raw open interest are three different products. SpotGamma is index-first, Unusual Whales is flow-first, Barchart is cheap open interest, OptionCharts is chart-first, and a self-hosted dashboard is free if your time is free.
| Tool | What GEX data it shows | Best for | Price |
|---|---|---|---|
| SpotGamma | SPX and index net GEX, zero gamma flip, call wall and put wall, gamma price profile; free GEX levels page | Index day traders tracking SPX structure | $10/mo app inside Robinhood Agent Apps; confirm other plan prices on SpotGamma's own pricing page |
| Unusual Whales | Live options flow plus GEX and open interest views across single stocks | Day traders who want flow-GEX and single-stock coverage | Free (data delayed 2 trading days), Retail Basic $50/mo, Pro $75/mo, Max $120/mo |
| Barchart | Options chains, open interest analysis, OI strike profile style views | Swing traders doing cheap open interest work | Free $0, Plus $9.99/mo, Premier $29.95/mo |
| OptionCharts | Visual options chain and open interest charting by strike and expiry | Chart-led traders who think in pictures | Not confirmed here; check the official OptionCharts pricing page |
| DIY Schwab API dashboard | Whatever you build: net GEX, strike profile, intraday ΔGEX | Technical traders and scalpers who want full control | $0 plus your time and a broker API key |
Two real drawbacks each, because no tool is clean:
- SpotGamma: index-centric, so single-stock coverage is thinner than flow platforms, and the $10 Robinhood Agent Apps price is not the same product as the full subscription. Confirm what each plan includes before paying.
- Unusual Whales: the free tier's 2-trading-day delay makes it useless for intraday decisions, and the full feed is a firehose that encourages overtrading if you have no rules.
- Barchart: no true dealer-positioning GEX model, so you are doing the gamma weighting yourself, and the $9.99 Plus tier still gates some data behind $29.95 Premier.
- OptionCharts: pricing and feature limits need verifying on the official page, and chart-first tools tend to be light on the flip-level math that matters most.
- DIY dashboard: you own every bug, and the sign convention you choose is the sign convention you get. For the build itself, start with this gamma exposure chart walkthrough rather than reinventing it.
FlashAlpha also runs a public GEX lab at https://lab.flashalpha.com, and flashalpha.com publishes the gamma exposure API documentation behind it, which is worth reading even if you never buy a thing. For a broader platform shootout, see our comparison of the best options flow platform options.
What do real users say about gamma exposure data?
Retail opinion on GEX splits hard between "useful context" and "vendor marketing." The most-cited skeptic thread, No rage bait but GEX, Order flow, market/volume profile etc. don't work, pulled 112 upvotes and 125 comments on r/Daytrading.
Three quotes, exactly as written, from the r/options thread asking whether GEX and options flow actually help:
"Short answer: it helps with context, not with entries." (u/zibudada)
"it's very easy to self host your own GEX dashboard with Schwab API for free." (u/NationalOwl9561)
"not at all, its vendor sorcery." (u/nq-FOMO)
Search "gamma exposure reddit" and you will find that same split on repeat. The useful read of it: the people who get value from GEX describe it as a range and regime filter. The people who call it sorcery are usually the ones who tried to use levels as entry triggers and got stopped out. Both groups are describing the same tool doing different jobs. Our roundup of honest AI stock tool reviews and what real users say runs into the same pattern across categories.
What are the alternatives to gamma exposure data?
If GEX feels like paying for an assumption, there are cheaper ways to get the same context. Volume profile, implied volatility rank, expected move from the straddle, and plain support and resistance all answer "how far can this travel today" without modeling anyone's book.
- Expected move from the at-the-money straddle. One number, derived from live prices, no positioning assumption. Free on most brokers.
- Volume profile and market profile. Where volume actually transacted. It is observed data, not inferred.
- Implied volatility rank. Tells you whether options are expensive relative to the last 12 months. Link that term and the rest of the vocabulary in our trading glossary if any of it is new.
- Options flow scanners. Directional information GEX does not carry, with its own interpretation problems.
- Open interest alone. Free on Barchart's $0 tier. Crude, honest, and surprisingly close to the gamma-weighted version at the biggest strikes.
- Rules-based automation. If the appeal of GEX is removing discretion, read what retail traders get wrong about algorithmic trading with AI before you subscribe to anything.
Choose GEX if you trade SPX or SPY intraday and want a regime filter. Choose expected move plus volume profile if you trade single names and want observed data. Choose neither if your process still lacks a written stop loss.
Final verdict on gamma exposure and GEX data
Gamma exposure is worth understanding and rarely worth $120 a month to a trader without a system. It earns its keep as a volatility-regime filter for index day traders. It fails as a directional signal, and it fails loudly on thin single-stock chains.
The strongest case for GEX: it explains why some days grind and some days travel, and it hands you a short list of levels that other participants are mechanically forced to care about. The strongest case against: every number rests on an assumption about dealer positioning that nobody outside the dealers can verify, and the open interest feeding it settled yesterday.
Start free. SpotGamma publishes free GEX levels, Barchart's base tier is $0, and Unusual Whales has a free plan at a 2-trading-day delay. Run the flip level and the call wall, put wall bracket alongside your normal setup for 30 days. If the levels improve your entries and exits, pay for faster data. If they do not, you just saved $600 a year. Process over prediction.
Stop paying for levels before you know which GEX view you need. The FullStack Alpha directory sorts 200+ AI stock tools by strategy, price and what they actually do, including the options and gamma category.
See the options tool shortlist: https://aistockpickerapps.com/ai-options-tools
Frequently asked questions about gamma exposure
What is considered a high gamma?
High gamma means an option whose delta changes fast per $1 move. At-the-money contracts with days to expiry carry the highest gamma, often several times a 30-day contract at the same strike.
How long does a gamma squeeze last?
A gamma squeeze usually runs days, not weeks, because it depends on options expiring. Once the dominant expiry settles, the dealer hedging that fueled it disappears and price often retraces hard. Squeezes tied to weekly contracts can fade within a few sessions. Treat any move past that as a different story driven by something else.
What is considered high gamma for options?
For options specifically, high gamma clusters at-the-money within roughly 0 to 7 days of expiry, where small price moves swing delta the most. Zero-day contracts carry extreme gamma near the strike and almost none away from it. Low gamma shows up in deep in-the-money, deep out-of-the-money, and long-dated contracts.
Where can I find gamma exposure?
Free sources include SpotGamma's free GEX levels page for SPX, Barchart's $0 tier for open interest, and Unusual Whales' free plan with data delayed 2 trading days. Paid options start around $9.99 a month at Barchart Plus. Technically minded traders self-host a dashboard with a broker API key at no cost.
Where can I find gamma exposure for free?
SpotGamma publishes free SPX gamma exposure levels including the zero gamma flip. Barchart's free account shows options chains and open interest at $0. Unusual Whales offers a free tier with a 2-trading-day data delay. A self-hosted Schwab API dashboard costs nothing but your time, as one Reddit user noted.
Is gamma exposure useful for beginners?
Mildly, and only as context. Beginners get more from position sizing rules and a written stop loss than from any GEX chart. If you do use it, limit yourself to four numbers: net GEX sign, the flip level, the call wall, the put wall. Skip the heatmaps until the basics are boring.
What is the difference between gamma and gamma exposure?
Gamma is a per-option Greek measuring how fast delta changes. Gamma exposure aggregates gamma across all strikes and expiries, weights it by open interest and spot price, and converts it into dollars of stock dealers must trade per 1% move. Gamma describes one contract. Gamma exposure describes the whole market's hedging pressure.
Conclusion and next steps
Gamma exposure answers "how violent is today likely to be," and that is a genuinely useful question. It does not answer "what should I buy," and no amount of subscription spend changes that. The flip level, the call wall, and the put wall are the three outputs worth your attention. Everything else on a GEX dashboard is detail.
Do this week:
- Write down the flip level, net GEX sign, call wall and put wall before each open. Free sources only.
- Log whether the day pinned or traveled. Ten sessions is enough to see the pattern.
- Compare your log against your own trade results. If positive GEX days are where you lose, stop fading in them.
- Only then decide whether faster data is worth $9.99, $50, or more.
Prices move faster than open interest does, so confirm current plans on each vendor's official pricing page before you hand over a card.
This is education, not financial advice.
Your market edge starts with the right tool. Stay alpha.
Some links in this article may be affiliate links, which may earn a commission at no extra cost to you.