What Is Options Flow? Read Big Money Trades With Context

What is options flow? It’s the stream of completed options transactions that shows which contracts changed hands, their size, and how they were executed, but not the buyer’s full strategy. A giant call purchase might express confidence, hedge another position, or close an existing bet. Your job is to read the receipt before copying the shopping cart.
What is options flow? Key takeaways
What is options flow in one line? A public receipt of trades, with the reasons left blank.
Options flow helps you investigate positioning, not identify guaranteed winners. Start with the contract and execution details, then check the underlying stock before risking capital.
- TradesViz: An ask-side call print can belong to a spread, roll, hedge, or closing transaction. 7
- Cboe: Sweeps and large blocks describe execution, not the participant’s predictive skill.
- Open Interest: Outstanding contracts and session volume measure different things.
- Greeks: Delta and gamma explain exposure better than premium alone.
- Scanner services: Evaluate the feed, education, and subscription terms separately.
- FullStack Alpha: Paper trade an interpretation before making it part of your process.
What is options flow, and why does understanding it matter?
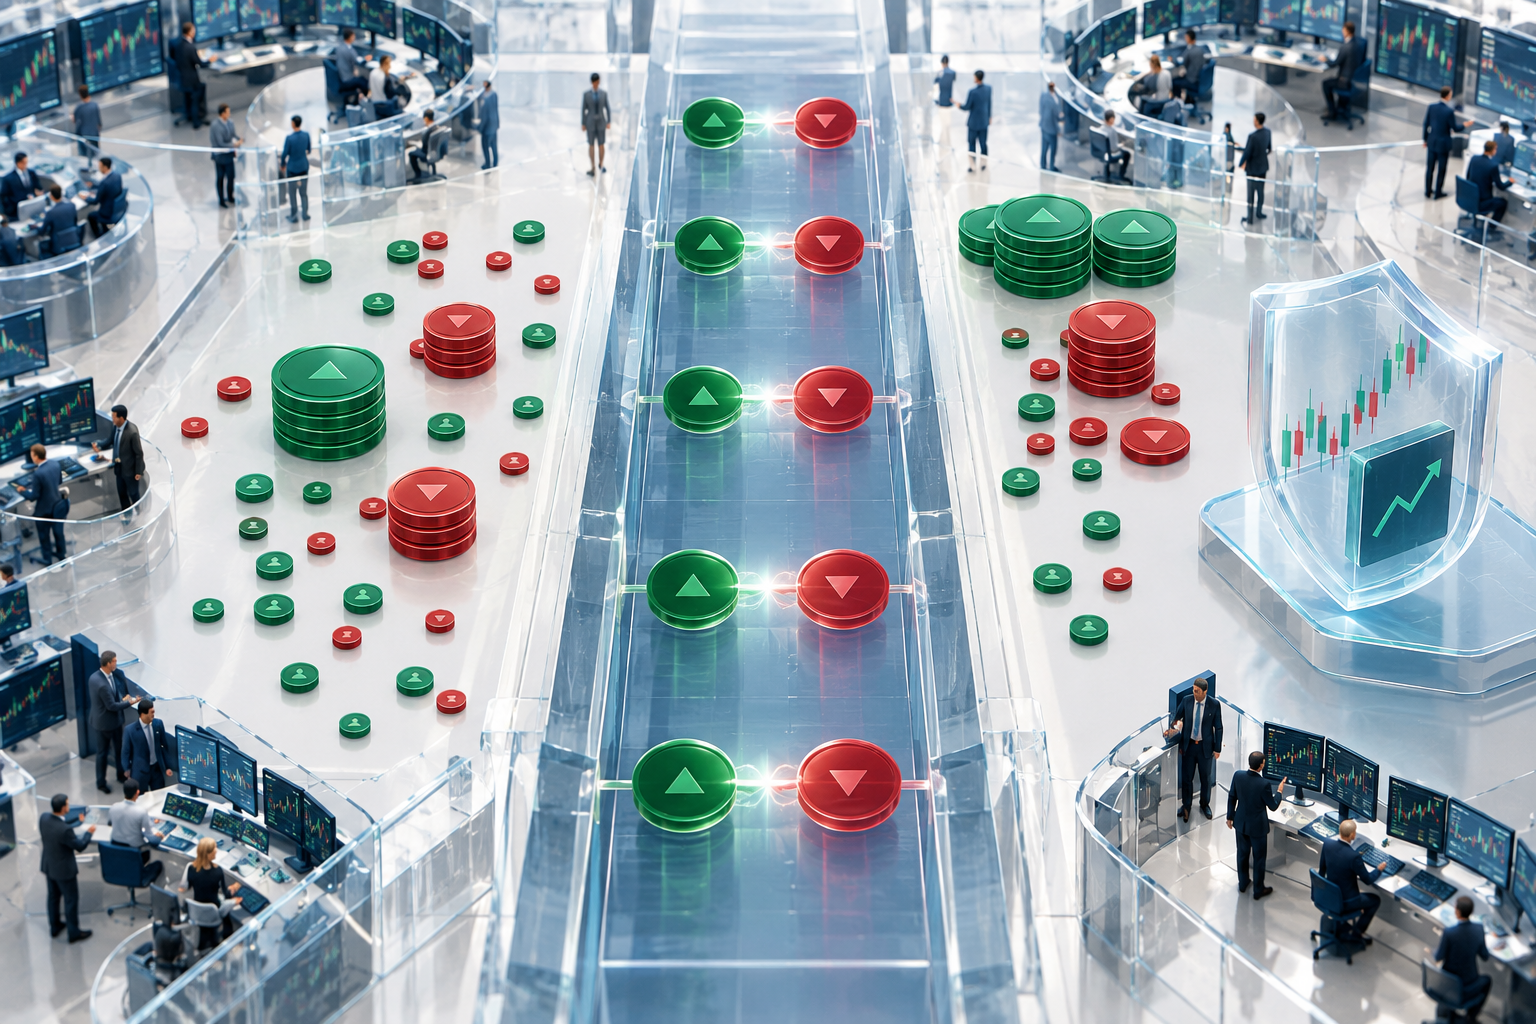
Options flow is a transaction-level view of activity in derivatives contracts. It matters because it reveals where participants are committing premium, although the public record usually cannot identify their portfolios, motives, or eventual results.
What is options flow at the data level?
A stock chart compresses transactions into candles. A derivatives feed lets you inspect individual executions or groups of related prints.
A feed commonly includes the underlying symbol, expiration, strike, call or put, contract count, premium, timestamp, and execution relative to the bid and ask. Some services add inferred sentiment or sweep classifications.
Those classifications are interpretations layered onto transactions. They are not direct access to an institution’s investment memo.
“Options Flow,” “Option flow,” and “Options Order Flow” often describe the same category of feed. Check the vendor’s definition: displayed order flow, completed executions, and inferred positioning are different products.
What is options flow volume doing in 2026?
Industry reports describe a much larger derivatives market:
Activity: Cboe reported average daily volume of 72.8 million contracts in the second quarter of 2026. 1
Growth: That activity was more than 19% above the comparable prior-year quarter. 1
Large executions: Nearly 10 million contracts daily traded in blocks exceeding 1,000 contracts. Size remained relevant, but intent stayed uncertain. 1
Monthly scale: OCC’s July report recorded approximately 1.55 billion contracts, up 25.7% year over year. 9
These figures describe participation, not an opportunity score. A busier feed can create more distraction as easily as more insight.
What are call versus put transactions?
Calls provide purchase rights; puts provide sale rights under their contract terms. Buying calls can express bullish exposure, while buying puts can express bearish exposure.
But every transaction has a buyer and seller. A call seller may be reducing exposure or collecting income. A put buyer may be protecting an existing stock holding.
When asking “what is options flow,” keep the missing portfolio in view. A print can look bearish while reducing the risk of a bullish portfolio.
What is options flow telling you, line by line?
Every alert answers four questions in order: which contract, how it filled, what it might belong to, and how much money moved.
Read the contract first, execution second, and possible strategy third. Premium size belongs near the end of the investigation, after checking whether related prints change the story.

Understanding the contract: a line-by-line analysis
Start with the underlying. An index, ETF, and individual company have different catalysts and settlement terms.
Next inspect expiration and strike. A near-expiry contract reacts differently from a longer-dated position. Then identify the call or put, transaction size, execution level, and premium.
Record the timestamp. Nearby executions in the same underlying may belong together, even when they involve different strikes or expirations. TradesViz recommends grouping related prints rather than treating each row as an independent opinion. 7
A useful journal line reads: “Possible aggressive call purchase; opening status unknown; related legs unresolved.” Less exciting than “institution buying.” More honest.
What is options flow scanning actually doing?
A flow scanner organizes prints and applies filters. It may classify transactions near the ask as buyer-initiated and transactions near the bid as seller-initiated.
Quotes move. Reports can arrive late. Complex packages can produce misleading standalone labels. An options order marked bullish is still an inference.
Use this comparison to separate the execution fact from the story attached to it.
| Term | What it means | Possible signal | Common misread |
|---|---|---|---|
| Sweep | Liquidity sought across venues | Execution urgency | Informed prediction |
| Block | Large grouped execution | Size worth investigating | Confirmed directional bet |
| Split | Execution divided into prints | Related activity | Independent buyers |
| Ask side | Execution near offer | Possible buying pressure | Always bullish |
| Bid side | Execution near bid | Possible selling pressure | Always bearish |
| Opening | New position established | New exposure | Proven by volume alone |
| Closing | Existing position reduced | Exposure removed | Fresh conviction |
Watch the flow: sweeps versus blocks
A sweep seeks liquidity across exchanges quickly. A block concentrates a large execution. Neither format proves superior information.
The scale is substantial: Cboe’s block discussion used executions above 1,000 contracts, but that threshold does not disclose whether a package was a hedge or outright speculation. 1
A split print deserves extra care. Several rows can represent the same participant completing the same instruction. Counting each as fresh conviction exaggerates the evidence.
Analyze the signal: gross premium versus net exposure
TradesViz describes a package showing $126 million in gross premium. Reading that as a standalone purchase would miss the package structure. 7
The same discussion gives $57 million in net premium after accounting for bought and sold legs. 7
The arithmetic difference is $69 million, calculated from those cited figures. That difference demonstrates how a headline total can distort the apparent commitment. 7
Net premium still does not equal maximum loss, margin requirement, or directional exposure. Ask what was bought, what was sold, and whether another asset offsets the package.
Validate and act: opening versus closing
Volume counts contracts traded during the session. Open Interest counts outstanding contracts after clearing.
Volume above prior open interest can flag activity worth reviewing, but it does not prove every execution opened a new position. Contracts can change hands repeatedly.
The next update may support an opening-position theory. It still cannot connect every change to a particular participant. If opening status is unresolved, write “unknown” rather than allowing the scanner’s color scheme to decide.
Options flow
Options Flow Print Checker
Is this print likely a new position, and how much weight should it get in your process?
Enter one print. The checker flags whether it is likely opening and how much weight it deserves in your process.
Size tiers are rough rules of thumb; adjust them to the stock's normal activity. Educational tool only, not financial advice.
Who should watch flow: day traders, swing traders, scalpers, or long-term investors?
Your holding period decides how much weight a single print deserves.
A day trader can use the feed for short-lived context, while a swing trader can investigate repeated activity around a planned catalyst. Scalpers need reliable execution details; long-term investors should treat the feed as a secondary risk clue rather than a valuation method.

How traders use the platform professionally
Professional-style analysis begins with a hypothesis and searches for contradictory evidence. It does not begin with the biggest green row.
For intraday trading, align the setup with liquidity and support and resistance. These are areas where buying or selling has repeatedly appeared. For swing trading, check whether the expiration gives the thesis enough time.
A long-term position investor may find put activity useful as a prompt to investigate a coming event. Public executions cannot replace earnings, balance-sheet research, or portfolio planning.
Flow versus stock price movement
A clean setup needs agreement from the underlying. Price action means the stock’s actual movement, including whether it holds a level after the breakout.
Tight consolidation is a narrow range. Basing is a period of stabilization. Both can provide clearer invalidation points than chasing an overextended move.
A low float means fewer readily tradable shares, which can worsen sharp swings. In choppy tape, direction reverses repeatedly. Attractive derivatives activity cannot remove those execution risks.
Use the swing-trade position-size planner to organize entry and exit assumptions, rather than letting headline premium dictate position sizing.
Key GEX levels and gamma exposure
GEX estimates gamma exposure. Gamma measures how delta changes as the underlying moves; delta estimates a contract’s sensitivity to that movement.
Dealer positioning can influence hedging demand. But a GEX chart relies on assumptions about who owns which positions, and those assumptions can be wrong.
A displayed GEX level can help frame a scenario. It is not a guaranteed floor or ceiling.
GEX mastery starts with model limits
Before using GEX, ask how the provider signs positions, updates open interest, and handles intraday transactions. Different GEX methods can produce different maps.
Do not confuse a polished GEX dashboard with observed dealer inventory. The useful question is whether the model improves your risk decisions when its assumptions fail.
What changes for 0DTE trading?
Same-day expiry leaves little room for delay. Cboe reported that zero-days-to-expiration volume rose 46.2% year to date during the first half of the reporting year. 1
That activity exceeded 20 million contracts daily, making short-dated activity a large share of the feed. 1
SPX same-day volume had nearly tripled since the beginning of 2024, according to the same report. A popular instrument can still be unsuitable for a beginner. 1
How do options flow scanners compare?
Every vendor answers “what is options flow” with a slick demo. Your job is to see what the feed shows when its label is wrong.
Choose a service by the decisions it helps you make, not the number of alerts it produces. Unusual Whales, Cheddar Flow, OptionStrat Flow, and BlackBoxStocks belong on a research shortlist, but current features, access, and subscription terms require direct confirmation.
Test the fit before you pay
The profiles below are shopping criteria built from desk research and public user sentiment, not ratings. Confirm current features and pricing with each vendor.
| Platform | Buyer fit to investigate | Question before purchase |
|---|---|---|
| Unusual Whales | Broader research alongside contract activity | Does the extra information help your actual method? |
| Cheddar Flow | A focused transaction-monitoring workflow | Can you inspect related prints without losing context? |
| OptionStrat Flow | Readers combining executions with strategy analysis | Can you move from an alert to a plausible package? |
| BlackBoxStocks | Readers comparing scanning with guided learning | What does current membership include? |
Use the Cheddar Flow profile, OptionStrat profile, and AI derivatives-tool directory to narrow the shortlist.
How to judge any flow service
The value of a transaction feed is inspection: you can challenge the label instead of accepting a summary.
Some services, BlackBoxStocks among them, bundle a scanner with education. Judge the feed and the classes separately. Ask whether the service lets you revisit an alert, inspect context, and identify the assumptions behind sentiment.
A product demo should help you get answers. It should not pressure you to copy trades you cannot explain.
Verify plan access before signing
Feature access varies by plan. Before signing, confirm which feed, historical view, export, and live features your plan permits.
Scanner access may have different conditions from class access. Access described as unlimited should have a written definition.
Save the offer before signing. Ask the vendor what changes at renewal and whether exchange-related charges sit outside the advertised subscription.
Proprietary does not mean accurate
Ask any vendor which parts are proprietary and which rely on licensed feeds. Proprietary software can add useful filtering, but a branded interface does not prove transaction labels are correct.
Assess every service on explainability and workflow fit, including services discussed in the Trade Echo profile.
Count the full cost
A subscription’s value depends on use. A bundled service may suit a reader who will attend instruction; another reader may only need a searchable feed.
Check billing terms before deciding what is affordable. You don’t improve risk-reward by collecting subscriptions you rarely open.
Free access can help you learn vocabulary. “Real-time option flow free” may instead mean delayed samples, restricted instruments, or limited history. You won’t know until you inspect the timestamp and coverage.
Evaluate any bundled classes
If a service advertises classes, ask who instructed each class and whether recordings preserve losing examples. A live class has value when it explains uncertainty, not merely successful calls.
Check paid classes separately from third-party material. The Options Industry Council, commonly shortened to OIC, should not be treated as a blanket endorsement of a paid service.
If an offer references OIC classes, confirm the relationship. Ask which sessions are instructed internally, which link elsewhere, and what access survives cancellation.
Judge instructors by their reasoning
An instructor’s name on a sales page does not establish credentials or results. For any instructor-led class, ask what was taught, request a complete example, and check whether the lesson shows mistakes. Unlimited replays are useful only if the reasoning survives review.
What is options flow unable to tell you?
Three blind spots never go away: motive, the rest of the portfolio, and the fill you would actually get.
The main limits are missing intent, uncertain classification, and the gap between reported executions and your available fill. Flow can support a decision, but it cannot reveal a complete portfolio or guarantee a stock move.
See the signal, not the noise
Many alerts describe related activity. A supposed cluster of buyers can be a spread, roll, or fragmented execution.
Institutional size is also an unreliable identity badge. Cboe reported almost 10 million block contracts per day, but that aggregate does not identify any individual participant. 1
Retail and institutional activity overlap. Institutions can be wrong; retail participants can hedge. Big money is a position size, not a character reference.
Which indicators help, and which mistakes hurt?
Useful checks include related-leg detection, execution quality, relative activity, subsequent open interest, and confirmation from the underlying.
Common errors include treating ask-side calls as automatically bullish, assuming a sweep is informed, and mistaking gross premium for risk. TradesViz’s $126 million package example demonstrates why leg-level context comes first. 7
An alert doesn’t excuse poor risk management. Set a stop loss or other invalidation rule before entry. Getting stopped out should trigger review, not revenge trading.
A stop order can slip. A defined-risk spread has contract, assignment, and execution considerations of its own.
How to spot unusual activity without making it this entire strategy
Unusual means different from a relevant baseline. Compare activity with the contract’s normal behavior, liquidity, and event calendar.
OCC reported year-to-date average daily volume above 70.8 million contracts in July. A fixed alert threshold may become less selective as participation grows. 9
ETF activity rose 59.1% year over year that month, which also argues for instrument-specific comparisons. 9
For that separate screening task, see the Barchart unusual-activity reading guide.
Can you make money, and is prediction reliable?
Profitability depends on entries, exits, costs, and loss control. Neither a large print nor an attractive chart provides a promised outcome.
Cboe said annual volume was tracking above 18 billion contracts. That measures activity, not trader profitability. 1
FLEX volume was approximately 46% higher than the prior year, while FLEX open interest rose more than 40%. Customized contracts add another reason not to treat all prints as comparable bets. 1
You can’t infer an edge from participation alone. Journal the setup, expected holding period, adverse movement, costs, and whether the interpretation was correct.
Top 5 things options flow traders watch
Ask “what is options flow showing me?” across five checks, in this order.
- Contract details. Underlying, expiration, strike, and call or put come first. A near-expiry contract behaves differently from a longer-dated one.
- Execution side. Ask-side and bid-side labels suggest buying or selling pressure, but quotes move and multi-leg packages can mislead.
- Sweep or block. A sweep shows urgency across venues and a block shows size. Neither proves superior information.
- Net premium, not gross. TradesViz showed a package with $126 million in gross premium but $57 million net once the sold legs were counted.
- Volume versus open interest. Volume above prior open interest can flag opening activity. The next open interest update is the confirmation.
What is options flow? Frequently asked questions
The practical answer to “what is options flow” includes its limits: transactions are observable, but motive is often inferred. These answers separate mechanics from claims that the evidence does not support.
Why do 90% of options traders lose money?
The 90% figure is not an established universal loss rate. Losses can come from overtrading, poor sizing, spreads, time decay, and misunderstood exposure. Traders who copy prints may also mistake a hedge or closing transaction for a fresh directional purchase, a classification problem described by TradesViz. 7
Can I make $1000 per day from trading?
A fixed daily income is not something a feed can promise. Returns vary with capital, strategy, costs, and risk, and losses remain possible. A professional process allows days with no suitable entry. Cboe’s participation figures describe transaction volume; they do not demonstrate that users can achieve a particular daily profit. 1
Do I need $25,000 to trade options?
No blanket balance requirement applies to every contract transaction. Requirements depend on jurisdiction, account type, strategy approval, broker policy, and applicable day-trading rules. Rules can change, so treat any claim about new day-trading rules with caution. Confirm the rules directly with your broker before placing an intraday trade.
Is order flow better than candlestick?
Neither replaces the other. Transaction records reveal executions; candlesticks summarize the underlying’s movement. Use the feed to form a hypothesis and the chart to assess whether behavior supports it. Both can mislead without context, especially when a supposedly directional print belongs to a multi-leg strategy rather than an outright purchase. 7
What is options flow investing compared with forex activity?
For an investor, the feed can flag positioning or hedging worth investigating, but it cannot determine a business’s value. Equity and index contracts also differ from currency derivatives and spot foreign exchange. Do not assume the same coverage or interpretation across products; Cboe’s cited report concerns the listed derivatives activity it describes. 1
Where can beginners get free option flow data?
Start with public educational examples and any broker resources you already have access to. TradesViz provides a public reading guide, but an article is not a free live feed. Before using a free scanner, check delay, coverage, and historical access. A sample can teach interpretation without being suitable for immediate execution. 7
What is options flow in simple terms?
It is the stream of completed options trades: which contract changed hands, how many, for how much premium, and where it filled against the bid and ask. It shows what traded, not why.
What is options flow data made of?
Each row usually shows the underlying symbol, expiration, strike, call or put, contract count, premium, timestamp, and execution side. Some services add sentiment or sweep labels on top, and those labels are interpretations.
What is options flow volume versus open interest?
Volume counts contracts traded during the session. Open interest counts outstanding contracts after clearing. Volume above prior open interest can hint at opening activity, but the next open interest update is the better check.
What is options flow sentiment, and can you trust it?
Sentiment labels are inferences, usually based on whether a print filled near the bid or the ask. Spreads, rolls, hedges, and late reports can flip the meaning, so treat the label as a question, not an answer.
What is options flow scanner software, and do you need it?
It is a service that collects prints, applies filters, and labels them. You need it only if you will review alerts against a written plan; free or delayed samples are enough to learn the vocabulary.
Conclusion: build a repeatable reading process
What is options flow good for, then? Spotting positioning worth a second look, not replacing your plan.
Use the feed to investigate transactions, then require a clear setup and a defined loss limit. The next step is to paper trade a watchlist entry and record what would disprove your interpretation.
Don’t buy a subscription because the alerts look expensive. You don’t need more urgency; you need evidence you can review.
For readers searching “full stack alpha,” the next research stop is the FullStack Alpha directory.
Compare 200+ tools by category and use case in the FullStack Alpha directory before adding another subscription.
References
The sources below support the reported figures and transaction-reading examples. All cited reports date from 2026.
State Of The Options Industry Options Market Continued To Break Records In Q 2 2026 - https://www.cboe.com/insights/posts/state-of-the-options-industry-options-market-continued-to-break-records-in-q-2-2026
How To Read Options Flow - https://www.tradesviz.com/blog/how-to-read-options-flow/
Occ July 2026 Monthly Volume Data 202686 - https://mondovisione.com/media-and-resources/news/occ-july-2026-monthly-volume-data-202686/
Affiliate disclosure: FullStack Alpha may earn a commission from qualifying purchases through affiliate links.