Barchart Unusual Options Activity: How to Read It Before the Move

Last updated: September 22, 2026
Barchart unusual options activity is the free page that flags contracts trading at volumes far outside their normal range, and reading it correctly, before the crowd notices, comes down to three columns most traders skip past. This is not a signal that tells you what to buy. It's a map of where size just showed up. What you do with that map is the whole game.
Key Takeaways
- Barchart's unusual activity screen flags contracts where daily volume outpaces existing open interest, the core tell that new positions, not old ones, are trading.
- A recent Barchart-flagged trade in Vertiv (VRT) saw over 8,600 deep out-of-the-money call contracts trade at more than 42 times the prior open interest at that strike.
- That same VRT trade carried an expiration 494 days out, a detail that changes how you should read the bet entirely.
- Barchart's symbol-level historical unusual activity data is gated behind Barchart Premier, last confirmed updated September 21, 2026.
- Reddit users on r/thetagang and r/options report mixed results: useful filters, occasional pricing glitches, and real losses from chasing high implied volatility names.
- Free scanners like Barchart, Unusual Whales, and OptionStrat all show where size traded. None of them show why, and that gap is where most retail traders get hurt.
- Apple's own options chain saw a Barchart-flagged spike in long-dated put volume that Barchart itself read as bullish, not bearish. Direction assumptions are where beginners get burned.
What Is Barchart Unusual Options Activity?
Barchart unusual options activity is a free screener that lists options contracts trading at volume that's abnormally high compared to their existing open interest, updated throughout the trading day for stocks and major indices. It's built for one job: showing you where money just moved, fast, in a specific contract, so you can decide whether that flow is worth investigating further.
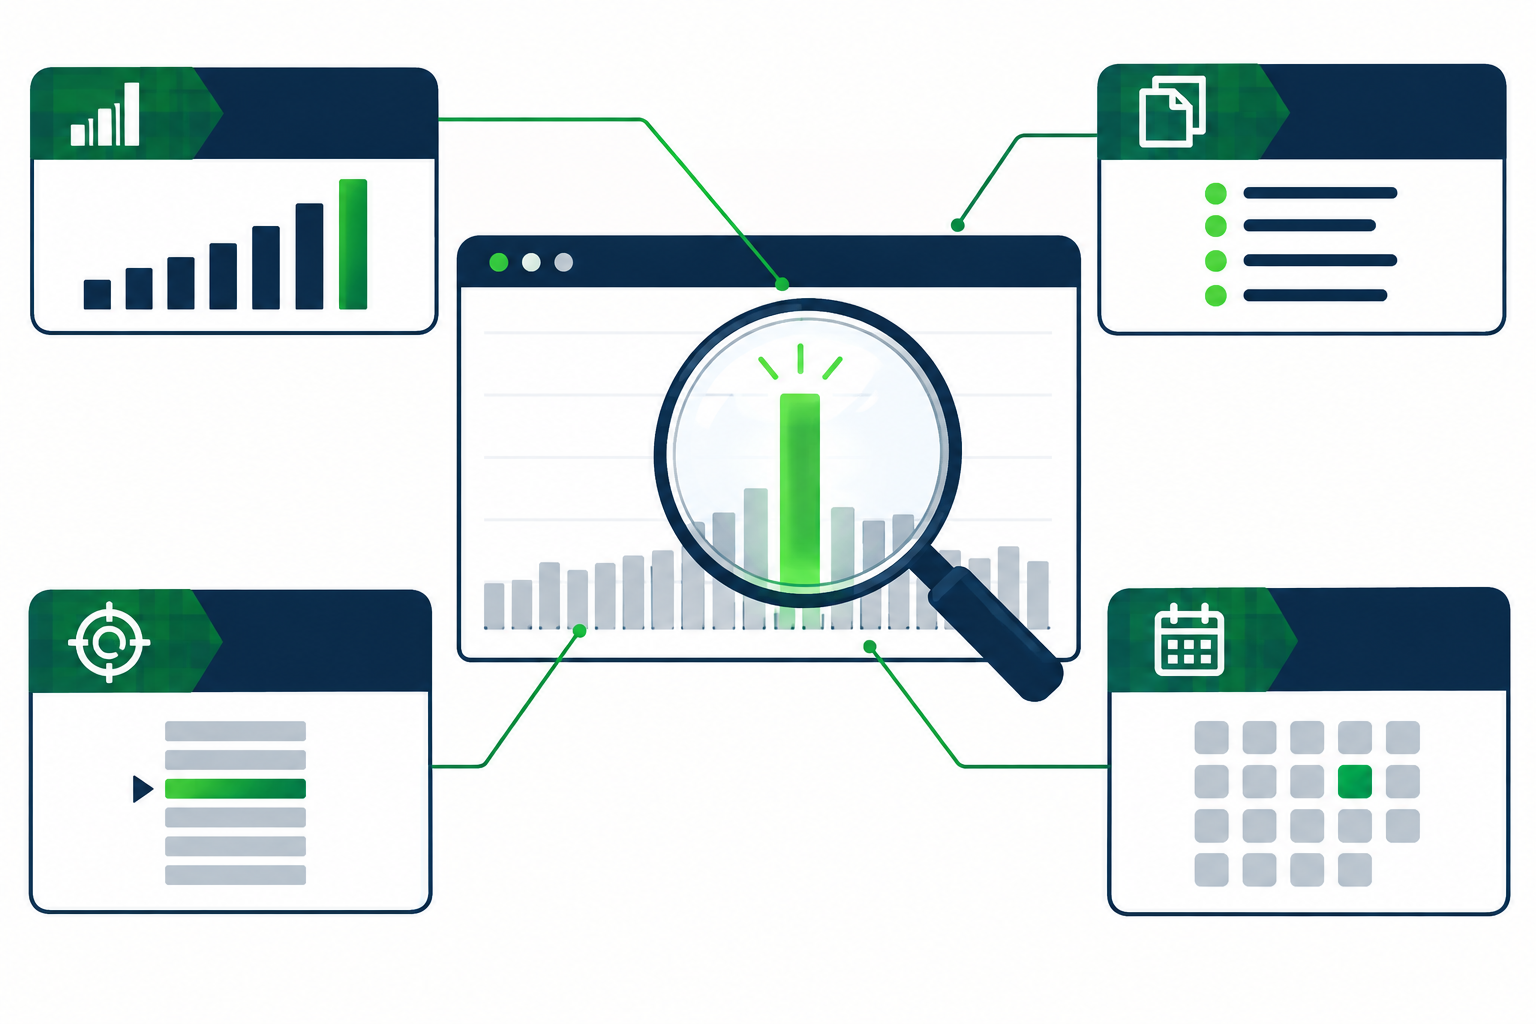
Here's what actually lives on the page, and why each part matters to you:
- The ticker and company name. Obvious, but it's the anchor. Every other column is meaningless without knowing what stock or index it's tied to. Benefit: you can scan a full watchlist in seconds instead of clicking into ten separate option chains.
- Strike price and expiration date. These tell you the bet's shape... how far the stock has to move, and by when. Benefit: you skip contracts that require an absurd move to pay off.
- Volume and open interest, side by side. This is the whole engine of the page (more on the math below). Benefit: you catch fresh positioning instead of old open interest that's just sitting there from last month.
- Implied volatility (IV). A rough read on how expensive the options are relative to expected movement. Benefit: it tells you whether you're paying a premium to chase the same idea everyone else already priced in.
The page pulls from Barchart's options data feed, which covers most optionable U.S. stocks and indices like $SPX, and Barchart also runs the same kind of unusual activity report for the S&P 500 Index itself, filterable by report date for Premier members.
Who is this for? Retail traders who want a free, no-login-required first look at where options flow is concentrating. It's not for anyone who wants a finished trade idea handed to them. Barchart shows you the fingerprint on the doorknob. It doesn't tell you who walked through the door, or why. U.S. markets closed doesn't mean the page goes dark either... after-hours filings and next-session setups still populate the list before the opening bell.
How Does Barchart Calculate Unusual Options Activity?
Barchart calculates unusual options activity primarily by comparing a contract's current trading volume against its existing open interest, flagging anything where volume significantly exceeds that baseline. The bigger that ratio, the more "unusual" the label. That's the entire mechanism, and it's simpler than most beginners assume.
What Causes Unusual Options Activity in Stocks?
Unusual options activity gets triggered by a burst of new contracts trading in a single name, usually because a large trader, fund, or algorithm opened a position all at once. Causes range from earnings positioning and merger speculation to simple hedging by a fund protecting a large stock position.
It isn't always a bullish or bearish tell by itself. A hedge fund buying puts to protect 500,000 shares of a stock it already owns looks identical, on the surface, to a directional bear bet. That's why context, which we'll get to, does the real work.
Unusual Options Activity vs. Normal Volume: What's the Difference?
Normal options volume moves with the stock and the calendar... more trading near earnings, less on a quiet Tuesday. Unusual options activity is volume that breaks that pattern relative to a strike's own existing open interest, not relative to the stock's average day.
A stock can trade its usual daily share volume with completely normal options activity. Or it can barely move on the chart while one specific strike sees volume 20, 30, even 40 times its open interest. That second scenario is what the page is built to catch.
The Confirmation Layer: Open Interest
Volume alone is noise. Open interest change is the confirmation layer that turns a volume spike into an actual signal. If volume spikes but open interest barely moves the next day, contracts likely just changed hands between existing holders, closing positions, not new conviction. If open interest jumps alongside the volume spike, new money entered. That's the difference between a swap meet and a land grab.
Barchart's own education material on volume change and unusual options frames this exact relationship as the backbone of the whole screen, and it's the single most misunderstood part of the page.
How Do You Read the Barchart Unusual Options Page?
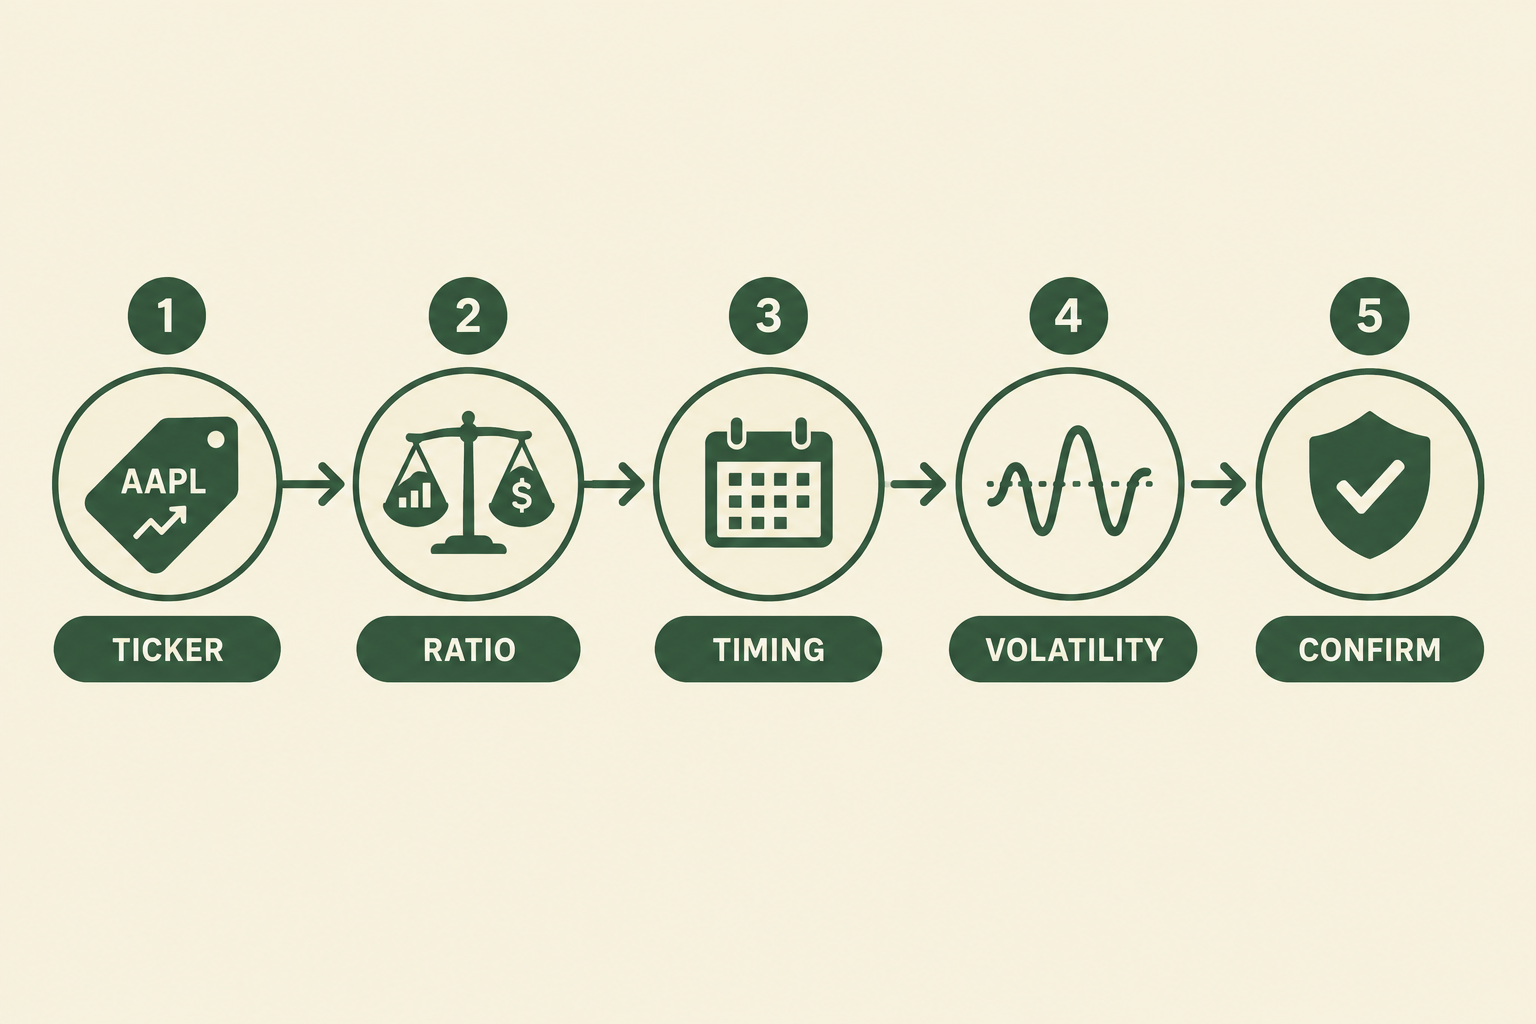
You read the Barchart unusual options page by working left to right across one row at a time: ticker, strike, expiration, volume, open interest, then implied volatility, checking each column against the others before drawing any conclusion. Skipping straight to volume is the single fastest way to misread the whole thing.
Walk through one hypothetical row the way you'd actually see it on the screen:
| Field | Example value | What it tells you |
|---|---|---|
| Ticker | VRT | The underlying stock in play |
| Strike | Deep out-of-the-money call | How far the stock needs to move |
| Expiration | ~494 days out | This is a long-term conviction bet, not a day trade |
| Volume | 8,600+ contracts | Fresh trading interest today |
| Prior open interest | roughly 200 contracts | The baseline before today |
| Volume-to-OI ratio | 42x | Extremely unusual by any standard |
| Implied volatility | Elevated relative to the stock's average | Options are pricing in a real move |
That specific setup is a real one Barchart flagged, documented on its own site: more than 8,600 call contracts trading at a strike expiring roughly 494 days out, over 42 times the prior open interest at that strike. Barchart read that as investors bullish on VRT, and the long expiration window is what makes it a conviction trade rather than a short-term flip.
What Are the Best Indicators of Unusual Options Activity?
The best indicators are a high volume-to-open-interest ratio, a strike that's meaningfully out-of-the-money, unusually large single-order size, and a matching move in implied volatility. Stack two or three of these and you've got something worth a second look. One alone is often just noise from a market maker adjusting a hedge.
How Far in Advance Does Unusual Options Activity Predict a Stock Move?
There's no fixed answer. Some flagged trades, like short-dated calls ahead of an earnings date, play out within days. Others, like the VRT trade with a 494-day expiration, are positioning for a move that could take a year or more to materialize, if it happens at all. Barchart's own case studies read as directional bets, not timed predictions, and treating them as a countdown clock is a mistake.
Why Does Unusual Options Activity Matter for Retail Traders?
Unusual options activity matters because it shows where large, informed capital is quietly building a position before that information becomes public news, giving retail traders an early, though imperfect, window into what institutions are betting on. That's the entire value proposition. It's also where the hype outruns the reality.
Why Institutions Use Options First
Institutions often position through options before touching the underlying stock because options let a fund put on size with less capital and less market impact than buying millions of shares outright. A large call buy moves the market far less than an equivalent stock purchase would, which is exactly why options flow can lead price action instead of following it.
Can You Make Money Trading Unusual Options Activity?
Yes, some traders do, but not by blindly copying every flagged trade. The realistic edge comes from using unusual activity as a watchlist filter, then confirming with your own chart read, support and resistance levels, and a defined risk-reward plan before entering. Treat it as a lead, not a trade signal, and size your position like you might be wrong.
Does Unusual Options Activity Always Mean a Big Price Move Is Coming?
No. A lot of "unusual" volume is a hedge fund protecting an existing position, not a fresh bet on direction. Apple's own long-dated put spike, flagged by Barchart in September 2026, was read as bullish, since buying puts can be protective hedging around an existing bullish stock position, not a bet against the company.
What This Really Tells You
What unusual options activity really tells you is where attention and capital are concentrated right now, across the options market, not what will happen next. It's a spotlight, not a crystal ball. The market truth here is simple: big flow reflects a bet, not a guarantee, and every bet has a loser on the other side of the trade.
More News From Barchart
Barchart runs a steady stream of these stories under its news and story feed... the VRT calls, the Apple puts, and similar recaps posted almost daily. Following that feed, alongside a free unusual options activity scanner or two, is a decent low-cost habit for building a watchlist without paying for anything.
Barchart vs. Unusual Whales vs. OptionStrat vs. Market Chameleon
No single free tool covers everything. Barchart wins on being free and already integrated with charts and stock quotes you're probably already using. Paid tools like Unusual Whales lean harder into real-time alerts and dark pool data. Here's how the four stack up.

| Tool | Free Tier | Real-Time | Filters | Best For |
|---|---|---|---|---|
| Barchart | Yes, delayed | No (Premier for more) | Basic, by symbol/date | First-pass free screening |
| Unusual Whales | Limited | Yes, paid tiers | Dark pool, sweeps, sector heat | Active flow traders |
| OptionStrat Flow | Yes, capped | Near real-time | Strategy builder overlay | Modeling a trade before entry |
| Market Chameleon | Limited | Delayed on free tier | Unusual volume, IV rank | IV and earnings screens |
The honest read: Barchart is the front door. If you outgrow it, that's when a paid layer like Unusual Whales or a modeling tool like OptionStrat starts to earn its subscription. For a broader look at what's out there, the best AI options trading tools breakdown covers the paid layer in more detail.
What Are the Limits of Barchart Unusual Options Data?
The biggest limits are delayed quotes on the free tier, occasional pricing accuracy complaints from users, and zero insight into why a trade happened. Barchart shows the "what." It never shows intent, and treating it like it does is the most common way retail traders lose money on this stuff.
Real feedback backs this up. One trader on r/thetagang put it plainly:
"I pay for barchart and I use it daily. Very customized filters. Basically anything you want."
But not everyone's experience is clean. From r/options:
"I just looked at the barchart option prices and it was so inaccurate in that it almost looks like they have the call and put prices switched."
And a cautionary note from another r/thetagang thread:
"barchart did help me find some good puts to sell, but I ended up chasing high IV tickers that put me in a bad place."
Is the Barchart Unusual Options Activity Scanner Accurate?
Accuracy depends on what you're measuring. The volume and open interest figures themselves come from real exchange data and are reliable as raw numbers. The interpretation layer, the "bullish" or "bearish" label Barchart slaps on a story, is a read, not a fact, and the Apple put example above proves that a "bearish-looking" trade can be a bullish bet in disguise.
Free-tier quotes also run on a delay, which matters more for a fast-moving name than a slow one. If you're trading around the print, that lag is the difference between catching the setup and buying the top of it.
How Much Does Barchart Premier Cost, and Do You Need It?
Barchart Premier unlocks historical unusual options activity by symbol, extra screener filters, and the barchart options calculator, on top of what the free tier gives you. Pricing changes, so confirm the current rate at checkout on barchart.com before you commit to anything.

Here's the real question: do you need it? If you're using the free unusual activity list as one input among several, a watchlist filter, not the whole strategy, you probably don't need to pay yet. If you're actively back-testing how often flagged trades in a specific sector actually played out, the historical data behind Premier starts to earn its keep.
How to Filter Barchart Unusual Options Activity by Stock Type
Barchart lets Premier users filter unusual activity by report date and by symbol, and the free screener can be sorted by volume, expiration, and moneyness to isolate large-cap names from small, illiquid ones. Filtering out thin, low-float names first cuts a huge chunk of false-positive "unusual" flags caused by tiny baseline open interest.
How to Set Up Alerts for Unusual Options Activity on Barchart
Barchart Premier members can save custom screens and check them daily; the platform doesn't push live push notifications the way a dedicated flow app does. If real-time alerts matter more to you than historical depth, that's the exact use case where a paid flow tool, or a broader AI stock alert app, starts to make more sense than Barchart alone.
How Should You Build a Process Around Unusual Options Activity?
You build a process by treating the unusual activity page as step one of a checklist, not the finish line: confirm the catalyst, check implied volatility, check open interest, check the chart, then size the position like you might be wrong. Skip any one of those steps and you're gambling, not trading.
The daily workflow that finds these trades looks something like this:
- Scan Barchart's unusual activity list, or a free unusual options activity scanner, for names with a volume-to-open-interest ratio worth a second look.
- Cross-check the news. Is there an earnings date, a merger rumor, a Fed event on the calendar? Confirm the activity across multiple signals before assuming anything.
- Check the chart. Is the stock in a clean setup, tight consolidation, basing, or already overextended into resistance?
- Check implied volatility. High IV means you're paying up for the same idea everyone else already spotted.
- Size the position. Small. This is confirmation for an idea, not a standalone thesis.
- Set a stop loss and a target before you enter, not after.
The Pattern Most Traders Miss
The pattern most traders miss is that unusual volume without a matching jump in open interest is often just existing holders trading with each other, not new conviction entering the stock. Chasing that kind of flow is how you end up exit liquidity for someone else's exit.
Common Mistakes People Make Reading Unusual Options Activity
The most common mistake is assuming call buying means bullish and put buying means bearish, when either can be a hedge. The second most common mistake is chasing deep out-of-the-money, high-IV names because the ratio looks dramatic, then getting stuck holding an option that decays to zero. Both are avoidable with a checklist.
Unusual Options Activity Before Earnings vs. Regular Trading Days
Activity flagged right before earnings season carries more built-in noise, since implied volatility runs hot for everyone regardless of size, making genuinely unusual flow harder to isolate. Activity on a random Tuesday with no news catalyst is rarer and, when it shows up, often more meaningful precisely because there's no obvious reason for it.
Is Unusual Options Activity Better Than Other Technical Indicators?
It's not better or worse, it's a different category. Price action, support and resistance, and volume on the underlying stock tell you what the crowd is doing. Unusual options activity tells you what a specific large player might be positioning for. Systems over hacks means using both together, never one instead of the other.
For traders who want more scanners built on this same idea, the best stock options screener guide and a roundup of swing-trade scanners both cover adjacent tools worth stacking into the same workflow. If your account is still under the old day-trading threshold, the small-account trading guide is worth a read too.
The Numbers That Matter
- 8,600+ call contracts traded in a single deep out-of-the-money VRT strike, per Barchart's own report.
- 42x the prior open interest at that same strike, the exact kind of ratio the unusual activity page is built to catch.
- 494 days until expiration on that trade, proof this was a long-horizon conviction bet, not a day-trade lottery ticket.
- September 21, 2026 is the last confirmed update date on Barchart's volume change and historical data page.
- September 14, 2026 is the last confirmed update on the $SPX unusual activity report.
- Apple's flagged long-dated put spike hit the wire on September 16, 2026, per Barchart's story feed.
Frequently Asked Questions
How to detect unusual option activity?
Detect it by comparing a contract's daily volume against its existing open interest. If volume is several multiples higher than open interest, that's the core tell. Free scanners like Barchart's unusual activity page, Unusual Whales, and OptionStrat automate this comparison so you don't have to pull it manually from a raw option chain.
How to read barchart?
Read Barchart's unusual options page left to right: ticker, strike, expiration, volume, open interest, and implied volatility. Compare volume against open interest first, that ratio is the headline number. Then check expiration and strike to understand the timeline and how far the stock needs to move for the bet to pay off.
What is the 3-5-7 rule in options trading?
The 3-5-7 rule is a risk management guideline: risk no more than 3% of your portfolio on a single trade, 5% across related trades, and 7% total portfolio exposure at any time. It's a position-sizing framework, not a Barchart-specific term, but it pairs well with any unusual activity idea you're considering acting on.
How to read option chain data?
An option chain lists every available strike and expiration for a stock, side by side with each contract's bid, ask, volume, open interest, and implied volatility. Read strikes near the current stock price first, compare bid-ask spreads for liquidity, and check open interest to confirm the strike isn't a ghost town before placing a trade.
Is Barchart unusual options activity free?
Yes, the core unusual options activity screen is free to view on barchart.com. Barchart Premier adds historical data by symbol, extra filters, and calculator tools on top of the free layer, at a price you should confirm directly at checkout since it can change.
How accurate is Barchart?
Barchart's raw volume and open interest numbers come from real exchange data and are generally reliable. Some users on Reddit have flagged option pricing display glitches, including call and put prices appearing switched. Treat the raw numbers as solid and double-check anything that looks off before trading on it.
What does volume-to-open-interest mean?
It's the ratio comparing how many contracts traded today against how many were already outstanding before today. A high ratio signals fresh positioning rather than existing holders trading among themselves, which is the core signal the entire unusual options activity page is built around.
Barchart vs. Unusual Whales: which is better?
Barchart is free and better as a first-pass daily screen. Unusual Whales is paid and better for real-time alerts, dark pool data, and sector-level flow heat maps. Most active flow traders end up using a free tool like Barchart to scan and a paid tool for confirmation and speed.
Can you screen unusual options on Barchart?
Yes. Barchart's free options screener lets you sort unusual activity by volume, open interest, expiration, and strike. Barchart Premier expands this with historical report access by symbol and date, useful for studying how past flagged trades actually played out over time.
Does Barchart show real-time options data?
No, not on the free tier. Free quotes run on a short delay. Barchart Premier and other paid options-flow tools offer closer to real-time data, which matters more for fast-moving, high-volume names than for slower, large-cap stocks.
How do I trade unusual options activity?
Use it as a filter, not a trade signal. Confirm the catalyst, check implied volatility and open interest, review the stock's chart for a clean setup, then size small and set a stop loss before entering. Never copy a flagged trade blind.
What is Barchart Premier?
Barchart Premier is the paid subscription tier that unlocks historical unusual options activity by symbol, deeper screener filters, and tools like the barchart options calculator. Pricing changes over time, so confirm the current rate directly at checkout on barchart.com.
Conclusion
Barchart unusual options activity is a free, genuinely useful first filter, not a finished trading system. The real skill isn't finding the flagged contract. It's knowing the difference between a hedge and a bet, between fresh open interest and recycled contracts, between a 494-day conviction play and a same-week gamble.
Run the checklist. Confirm the catalyst, check the ratio, check the chart, size small, and set your stop before you're in the trade, not after you're already down. Cut the noise, keep the alpha.
One tool, scored one way, is never the whole picture. There are 200+ AI stock tools catalogued in the FullStack Alpha directory, filterable by category, price, and what they actually do.
Browse the directory → aistockpickerapps.com
This article contains affiliate links. FullStack Alpha may earn a commission if you sign up through a link on this page, at no extra cost to you.