52-Week High Stocks: What the Breakout List Won't Tell You
52-Week High. These Stocks Just Might Explode, but Don't Take Our Word for It.
Last updated: October 5, 2026
Quick Answer
A 52-week high is the highest price a stock has traded over the past year. Stocks that hit one often keep running, which is why the headline "52-week high. These stocks just might explode, but don't take our word for it" shows up every week. The research behind it is real but narrow: it supports portfolio-level momentum over 6 to 12 months, not a promise about any single ticker. Names like Hewlett Packard Enterprise, AMD, ASE Technology, CrowdStrike, Cloudflare, and Fortinet cleared fresh highs recently . Whether you should buy them depends entirely on your entry, your stop, and your position size.
Key Takeaways
- A 52-week high is the top print of the trailing year. A 52-week low is the bottom. Both are context markers, not signals by themselves.
- Academic momentum work ranks stocks by current price divided by 52-week high, then holds the top group for 6 to 12 months. That's a basket strategy, not a stock tip.
- Recent breakouts included HPE around $69.33, AMD near $633.91, ASE Technology near $47.45, Cloudflare near $349.02, and Rubrik near $109.55 .
- Fortinet traded near $180.95 while the analyst consensus sat at "Hold" with an average target of $152.79. New highs and cheap valuations are not the same thing.
- A new high with no volume behind it is a bull trap waiting to happen. Volume is the confirmation.
- Free screens at Yahoo Finance, WSJ, and WallStreetZen will hand you the list . The list isn't the hard part. The plan is.
- Beginners should paper trade it first and keep position size small. Breakouts fail often enough that your stop matters more than your pick.
What Does 52-Week High Mean in Stocks?
A 52-week high is the highest price at which a stock has traded during the previous 52 weeks, measured intraday or at the close depending on the data provider. When a stock prints a new one, every single person who bought it in the past year is sitting on a gain.
That last part is the whole mechanic. No trapped sellers waiting to break even. No overhead supply. Think of it like a crowded elevator suddenly emptying out at the top floor... there's nobody in the way.
Two details that trip people up:
- Intraday vs closing high. Some screeners flag a stock if it touched a new high during the day. Others require a closing high. A stock that spikes to a new high then closes red is a different animal than one that closes at the highs.
- Rolling window. The 52-week high moves. A stock can clear its high in March, chop for four months, and clear a new high in July. Same stock, different setup.
Market truth: A new high tells you demand is winning right now. It tells you nothing about what the business is worth.
How Do You Find Stocks at 52-Week Highs?
Every major financial site publishes a free list, updated daily. The Wall Street Journal maintains a new highs and lows table , WallStreetZen runs a 52-week-high screen , StockMarketWatch publishes a daily screen , and Public.com and Money365 both offer near-high and at-high filters .
Where to look, roughly in order of usefulness:
- Your broker's scanner. Free, already funded, already connected to your watchlist.
- Yahoo Finance recent 52-week highs screen. Fast and sortable. Recent lists included Moderna near $190.01, Revvity near $151.53, Twist Bioscience near $188.67, and 10x Genomics near $93.50.
- Finviz or Stock Rover for adding fundamental filters on top of the price screen. Our Stock Rover vs Finviz screener comparison breaks down which one gives you more for the money.
- AI-ranked scanners when you want the list pre-sorted by something other than price. See how an AI stock scanner narrows 200 candidates to 5.
Common mistake: treating the raw list as a buy list. A daily new-highs screen can return 80 names in a strong tape. Forty of them are low-volume garbage riding a sector bid.
Decision rule: Add a minimum average daily volume filter (500,000 shares is a reasonable floor) and a minimum price filter ($10) before you look at a single chart. That cuts the list by half and removes most of the low-float noise.
Are Stocks at 52-Week Highs Good to Buy?
As a group, historically, yes. Individually, it depends entirely on your risk management. The George-and-Hwang research, summarized by Springer in 2026, ranks stocks by current price divided by 52-week high and compares the top group to the bottom group over the next 6 to 12 months. The top group has tended to outperform.
Read that sentence again, because the detail that matters gets skipped constantly: it's a ranked portfolio held for months, not a single breakout bought on a Tuesday afternoon.
The behavioral explanation is anchoring. Investors mentally fix on a stock's old price range and underreact to genuinely good news, so prices drift upward for a while after the news lands. Alpha Architect's summary of the original work describes exactly this mechanism.
| What the research supports | What it does not support |
|---|---|
| Diversified baskets of near-high stocks | Any one stock "exploding" |
| 6 to 12 month holds | Day-trade entries off a headline |
| Ranked, rules-based selection | Picking the three names you've heard of |
| Rebalancing on a schedule | Holding forever and hoping |
Practical takeaway: If the research is your reason for buying, apply the research's rules... a basket, a ranking, a holding period. Buying one ticker off a new-high list and citing academic momentum is like quoting a nutrition study to justify a donut.
52-Week High vs 52-Week Low: What's the Difference?
The 52-week high is the top of the trailing-year range. The 52-week low is the bottom. The difference that actually matters is who's trapped. At a high, nobody from the past year is underwater. At a low, almost everyone is.
That changes the behavior of the stock:
- Near a high: sellers are taking profits by choice. Supply is price-insensitive and thinner.
- Near a low: sellers are relieved exits. Every bounce brings out people who just want their money back, which caps rallies. That's overhead supply.
Buying a 52-week low because it "looks cheap" is catching a falling knife more often than it's bargain hunting. A stock making new lows is telling you the market's opinion of it is still deteriorating.
Edge case: A stock at a 52-week low after a one-time, fixable event (a settled lawsuit, a resolved recall) is a legitimate value setup. A stock at a 52-week low because revenue is shrinking is not.
Why Do Stocks Jump After Hitting a 52-Week High?
Three reasons, and only one of them is about the company. New highs trigger momentum buyers and technical screens, they clear out short sellers who get squeezed, and they often coincide with genuinely improving fundamentals that the market is still digesting.
HPE is a clean recent example. The stock closed at $69.33 on October 2, up 7.36% that day, after reaching a 52-week high near $70.29 . What drove it was substance: a $1.2 billion order from Vultr for AMD Helios AI-rack systems (HPE's first announced Helios order, per HPE Investor Relations), fiscal Q3 networking revenue up 74.9% year over year to $2.9 billion, fiscal 2026 revenue-growth guidance raised to 34%,37%, and free-cash-flow guidance of at least $3.75 billion. Barclays, Citi, and Wells Fargo all raised targets, with analysts framing Helios as potentially more than $1 billion of networking opportunity over two years.
So the price went up, then more buyers arrived because the price went up, and the underlying business had actually changed. All three layers at once.
Where it goes wrong: when layers two and three are missing. Price goes up, screens flag it, momentum buyers pile in, and there's no earnings story underneath. That's a bull trap... a breakout that fails and traps everyone who chased it.
Best Stocks Hitting 52-Week Highs Today, and the Honest Caveat
No one can hand you a list of stocks that will keep going up, including us. Here's what actually cleared fresh highs in the recent screens, with the numbers that justified the moves and the numbers that complicate them.
| Stock | Recent high level | What's behind it | The caveat |
|---|---|---|---|
| HPE | ~$70.29, closed $69.33 | $1.2B Vultr Helios order; networking +74.9% YoY | AI-order concentration; execution risk |
| AMD | ~$633.91 | Market cap near $1T; World Labs acquisition agreement; TCS India Helios partnership | Priced for flawless AI demand |
| ASE Technology (ASX) | ~$47.45, ~5% above prior high | AI chip packaging and test demand; ~$118B cap | Roughly quadrupled from ~$11 a year earlier |
| CrowdStrike | Near record | FQ2 2027 revenue $1.47B, +26% YoY; ARR $5.84B, +25% | Premium multiple leaves no room for a miss |
| Fortinet | Billings growth; Q3 earnings set for Oct 28, 2026 | Consensus "Hold," avg target $152.79 | |
| Cloudflare | ~$349.02, ~7.5% above prior high | AI-infrastructure narrative | Valuation well ahead of earnings |
| Rubrik | ~$109.55, ~7.2% above prior high | Data-security demand | Short public track record |
Nineteen stocks cleared fresh 52-week highs in a single recent week , and the list skewed hard toward semiconductors, cybersecurity, and AI infrastructure. Moderna, SentinelOne, Palo Alto Networks, and Lumentum also appeared in recent-high screens.
Look at Fortinet for a second, because it's the most instructive one on the table. Up roughly 108% in a year, trading near $180.95, and the aggregate analyst view was a "Hold" with a $152.79 average target. Goldman Sachs and Barclays sat near $190. The crowd of analysts, in other words, thought the stock was already past fair value while the price kept climbing.
Market truth: Both things can be true at once. Momentum and overvaluation coexist for long stretches. Which one wins in the next six months is not knowable, which is exactly why you use a stop loss instead of a conviction speech.
If you want help separating real AI revenue from narrative, our breakdown on how to tell real AI stocks from hype covers the filters.
What 52-Week High Stock Screener Tools Actually Help?
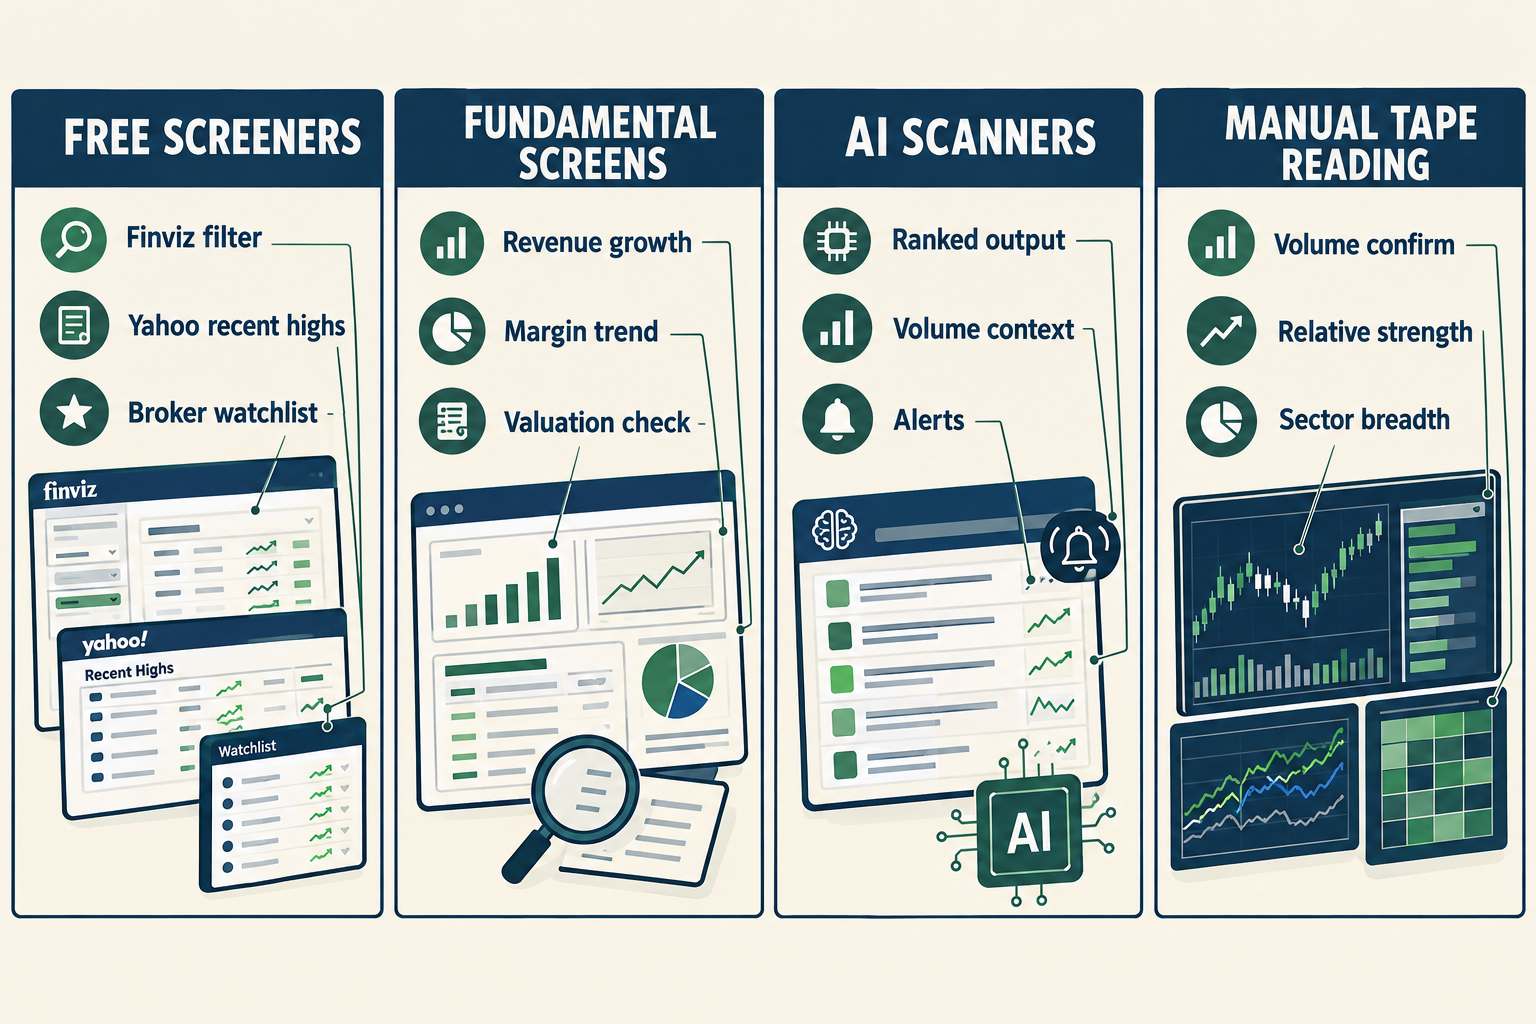
The free screens give you the list. Paid tools earn their keep by adding context: volume quality, relative strength, fundamental health, and alerts so you aren't refreshing a browser tab at 3:50 p.m.
A reasonable stack, from free upward:
- Free: WSJ new highs and lows table , WallStreetZen's daily 52-week-high screen , StockMarketWatch , Money365's near-high screener , Public.com's 52-week high page . Start here. Also useful: our free AI stock prediction tools and the stock health scorecard for a fast fundamentals check on anything the screen surfaces.
- Mid-tier: Finviz Elite, Stock Rover, TradingView for charting and alerts.
- AI-ranked: scanners that sort candidates rather than just list them. The AI stock analysis tools that catch red flags piece covers which ones flag deteriorating fundamentals hiding behind a rising price.
Decision rule: Choose a free screen if you check once a day and trade swing timeframes. Choose a paid scanner with intraday alerts if you trade the actual breakout and need to know within seconds, not hours. Paying for real-time data you never use is just a subscription you forgot to cancel.
Is It Too Late to Buy a Stock at a 52-Week High?
Not automatically. But it is too late if the stock is extended far above its base with no logical stop placement. The question isn't "has it already moved." It's "where's my invalidation point, and can I live with that loss."
Run this check before any new-high entry:
- How far above the breakout level is it? If it's 15% above the base and your stop belongs below the base, you're risking 15% on a single trade. That's not a trade, that's a hope.
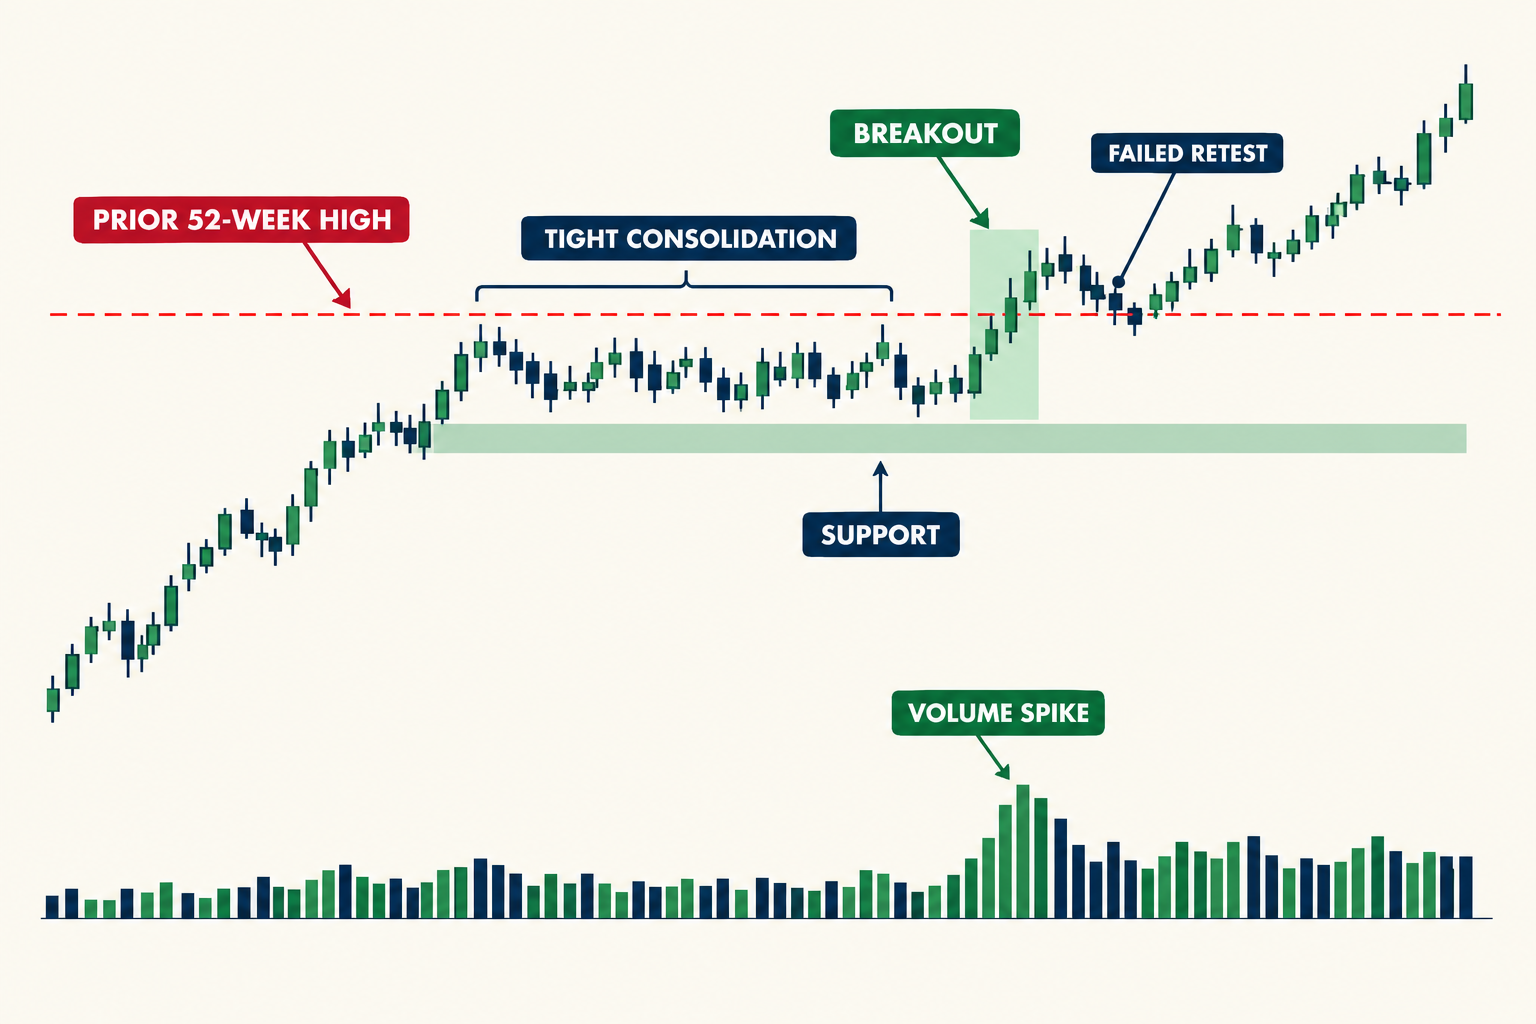
- Is there a tight consolidation nearby? A stock that bases for three to six weeks then clears the high gives you a clean, close stop. That's a clean setup.
- Is volume confirming? New high on 3x average volume beats new high on 0.6x average volume every time.
- What's the risk-reward? If the nearest sensible stop is 4% away and your target is 12% up, the math works. Reverse those and it doesn't.
The common mistake: confusing "I missed the first move" with "I must buy now." Missing a move costs you nothing. Chasing an extended stock without a stop costs you real money. FOMO is not a setup.
Overextended stocks also gap down hard. A gap fill (price returning to close the gap it left) can erase weeks of gains in a session.
Stocks at 52-Week Highs That Are Still Undervalued: Does That Exist?
Yes, and it's the narrow lane where momentum and value overlap. A stock can print a new high while its valuation multiple contracts, which happens when earnings grow faster than the share price.
How to screen for it:
- Forward P/E or PEG ratio at or below sector median, despite the new high.
- Earnings revisions trending up, not flat.
- Free cash flow growing, not just revenue.
- Price up less than earnings over the trailing year.
HPE sits closer to this bucket than most of the 2026 breakout list. A 34%,37% revenue growth guide with at least $3.75 billion in free-cash-flow guidance is a different profile from a name trading on a 2029 TAM slide.
Edge case to respect: Cheap-looking multiples on cyclical hardware names can be a trap. If the earnings are peak-cycle, the P/E looks low right before estimates get cut. Check whether the growth is secular (AI buildout) or cyclical (one big order).
How to Trade Stocks Breaking 52-Week Highs
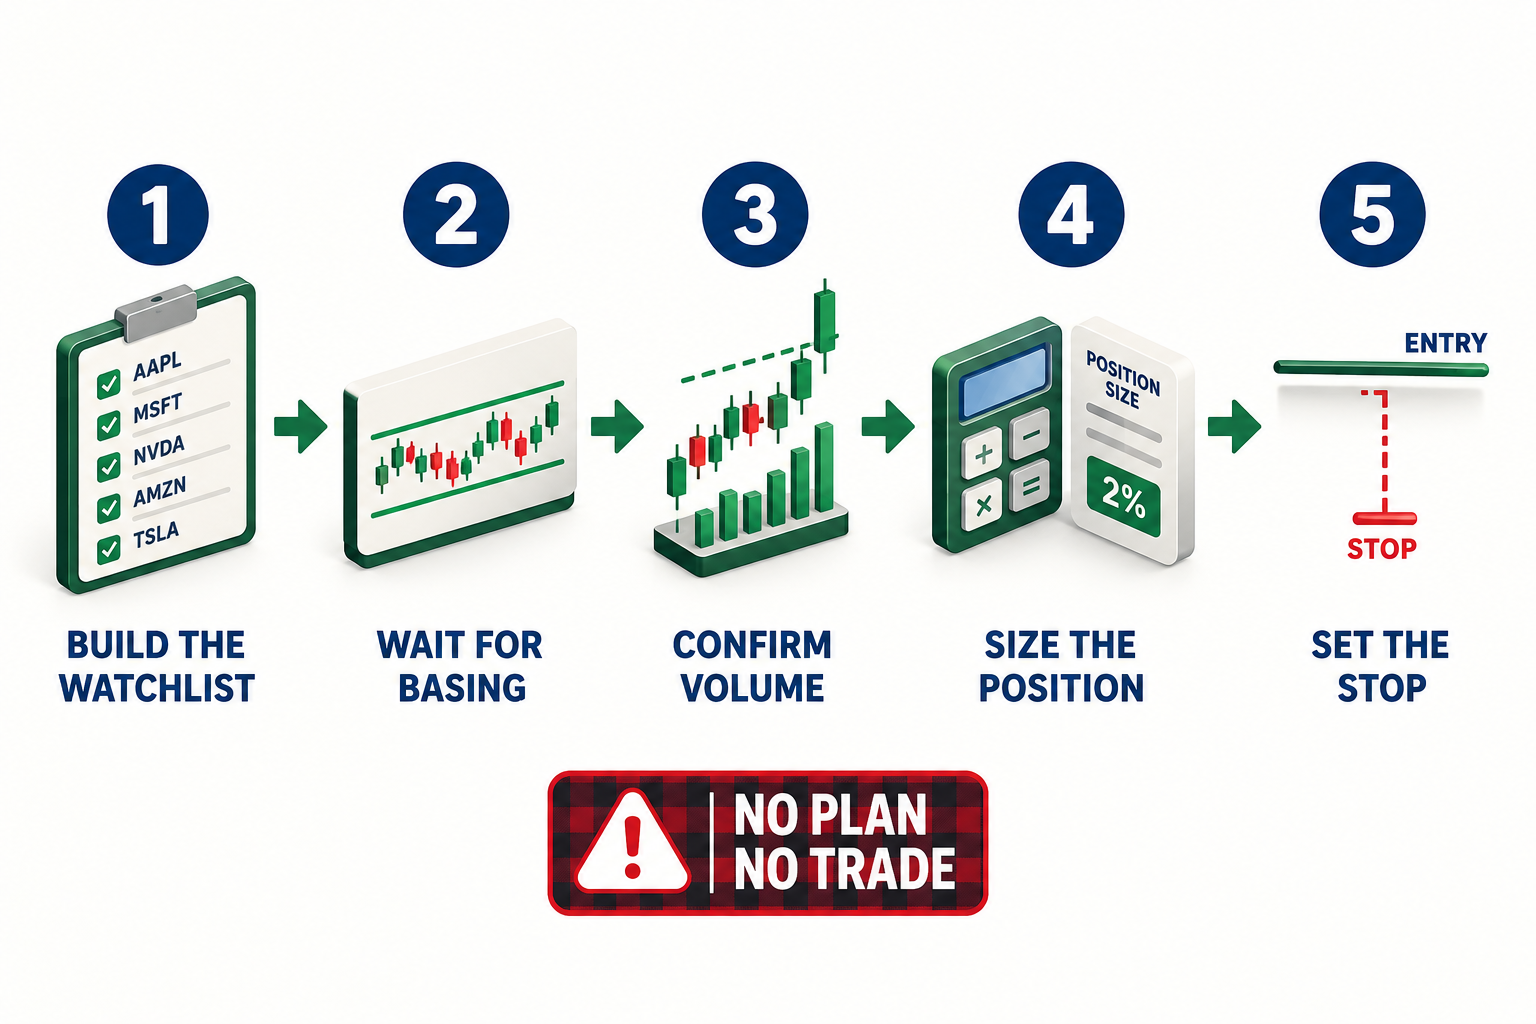
Wait for the base, confirm with volume, size the position before you enter, and set the stop below the breakout level. That's the whole framework. Everything else is decoration.
The process, in order:
- Build the watchlist the night before. Pull the new-highs and near-highs screens. Keep 5 to 10 names, not 40. Our guide on finding swing trade candidates early covers the pre-market version of this.
- Require a base. Tight consolidation, three weeks or more, with contracting volume. Stocks that go straight up with no rest give you nowhere to hide a stop.
- Confirm volume on the break. Above-average volume on the breakout day. No volume means no conviction means likely failure.
- Size the position first. Decide what percentage of your account you'll lose if the stop hits. One to two percent is standard. Use a swing trade position size calculator so this isn't a vibe.
- Place the stop below the base, not below your entry. Stops belong at the level that proves you wrong, not at the number that makes you comfortable.
- Let winners run, cut losers fast. Trail the stop as it moves. Don't add to losers.
Market truth: Breakouts fail regularly, even in strong markets. A strategy with a 45% win rate and 2.5:1 average risk-reward makes money. A strategy with a 70% win rate and no stops does not.
Common Mistakes When Buying 52-Week High Stocks
The expensive errors are behavioral, not analytical. Most people who lose money on breakouts picked a fine stock and managed it badly.
- Chasing extended names. Buying 12% above the base with a stop 12% below. Play stupid games.
- No stop at all. "I'll just watch it closely" is not a stop. It's a plan to freeze.
- Oversizing because of conviction. The strongest-looking setup should not get triple the normal size. Conviction is not an edge.
- Buying the low-float spike. Thin float, 40% day, headline-driven. Those fill badly and reverse violently.
- Ignoring earnings dates. Fortinet reports Q3 on October 28, 2026. Holding a breakout through earnings turns a technical trade into a coin flip.
- Revenge trading after a failed breakout. One stop-out leads to a bigger, worse entry an hour later. This wrecks more small accounts than bad stock picking.
- Mistaking a dead cat bounce for a breakout. A beaten-down stock popping 8% off the lows is not a new high. Check the actual range.
52-Week High Stocks vs Growth Stocks: Same Thing?
No. "52-week high" is a price condition. "Growth stock" is a business description. They overlap often, which is why people conflate them, but they're measuring completely different things.
| 52-week high stocks | Growth stocks | |
|---|---|---|
| What it measures | Price relative to trailing year | Revenue and earnings expansion |
| How you find them | Technical screen | Fundamental screen |
| Can a value stock qualify? | Yes, routinely | No, by definition |
| Typical holding logic | Momentum, 6-12 months | Business thesis, multi-year |
| What invalidates it | A break below support | Growth deceleration |
A utility stock, a bank, or an insurer can all print 52-week highs. None of them are growth stocks. Meanwhile a growth stock can be 40% off its high and still growing revenue 30% a year.
Decision rule: If you're trading price, the technical condition is your signal and your stop is your risk control. If you're investing in a business, the new high is irrelevant to your decision... it just tells you what you'll pay.
Can a Stock Go Higher After a 52-Week High?
Obviously, and this is the single most common beginner block. Every multi-year winner made dozens of 52-week highs on the way up. Each new high was somebody's reason not to buy.
ASE Technology illustrates it. The ADR traded near $47.45, roughly 5% above its previous 52-week high, with a market cap around $118 billion, after rising from about $11 a year earlier . Anyone who refused to buy at $20 because it was "at a 52-week high" sat out the rest.
A 52-week high is not a ceiling. It's a measurement of the past 12 months. Stocks don't know what their old range was.
What limits further upside isn't the high. It's one of these:
- Earnings growth slowing or guidance coming down
- Multiple expansion already pricing in several years of perfection
- Sector rotation pulling money out of the whole group
- The broader tape turning choppy and killing all breakouts at once
52-Week High Stocks for Beginners: Where to Start
Paper trade the setup for 30 days before risking real money, and keep your first live positions small enough that being wrong is boring. The 52-week-high breakout is one of the more beginner-friendly setups because the entry trigger and the stop level are both objective. That's a feature.
A starter plan:
- Learn the vocabulary first. Support, resistance, volume, stop loss, position size. Our stock market glossary with 200+ definitions handles the terms. Investopedia's definitions are solid too.
- Pick one screen and one timeframe. Daily charts, swing holds of days to weeks. Don't try intraday breakouts in week one.
- Paper trade 20 setups. Log entry, stop, exit, and reason. Count your win rate and average risk-reward honestly.
- Go live at 1% risk per trade. Not 1% position size. One percent of the account lost if the stop hits.
- Review monthly. Were the losses your process or your discipline? Those have different fixes.
Beginners also need to know what the regulators say about active trading risk. FINRA and Investor.gov both publish plain-English material on day trading risk and margin that's worth 20 minutes before you start.
Tough love: If you can't state your stop before you enter, you don't have a trade. You have a position and a feeling.
Conclusion: The List Is Easy. The Discipline Isn't.
Nineteen stocks cleared fresh 52-week highs in one recent week . HPE at $69.33 with a $1.2 billion Helios order behind it. AMD near $633.91 with a trillion-dollar market cap in sight. ASE Technology up roughly 4x in twelve months. Fortinet up 108% while analysts averaged a $152.79 target on a $180 stock.
All of that is public. None of it is an edge. The edge is what you do after you have the list.
Do these four things this week:
- Pull one free 52-week-high screen and filter it to names above $10 with 500,000+ average daily volume.
- Keep only the ones that based for three weeks or more before breaking out. Delete the rest.
- For each survivor, write down the entry, the stop below the base, and the position size. If the risk is over 2% of your account, skip it.
- Paper trade all of them for 30 days and log the results. Let the data argue with your instincts.
That wasn't on anyone's bingo card in January: cybersecurity, chip packaging, and server hardware leading the new-highs list. Which is the point. The names rotate. The process doesn't. Discipline beats prediction.
Fewer tabs, fewer alerts, one repeatable checklist. Cut the noise, keep the alpha.
One topic covered in depth here. There are 200+ AI stock tools catalogued in the FullStack Alpha directory, filterable by category, price and what they actually do.
Browse the directory → aistockpickerapps.com
FAQ
What is a 52-week high?
The highest price a stock has traded in the past 52 weeks. Some data providers measure it intraday, others on a closing basis, so the same stock can appear on one new-high list and not another.
Is a 52-week high a buy signal?
Not on its own. Momentum research supports buying diversified baskets of near-high stocks and holding 6 to 12 months. It does not support buying any single stock without a stop loss.
Where can I find stocks at 52-week highs for free?
The Wall Street Journal publishes a daily new highs and lows table, and WallStreetZen, StockMarketWatch, Public.com, and Money365 all run free 52-week-high or near-high screens.
How many stocks hit 52-week highs in a typical week?
It varies with market conditions. One recent week saw 19 stocks clear fresh highs, heavily weighted toward semiconductors, cybersecurity, and AI infrastructure.
Which stocks recently hit 52-week highs?
Recent breakouts included HPE ($70.29), AMD ($633.91), ASE Technology ($47.45), Cloudflare ($349.02), Rubrik ($109.55), and Fortinet ($180.95), with CrowdStrike trading near record levels.
Can a stock go higher after its 52-week high?
Yes, routinely. ASE Technology traded about 5% above its prior 52-week high after rising from roughly $11 a year earlier. Sustained uptrends consist of repeated new highs.
What's the difference between a 52-week high and a 52-week low?
The high is the top of the trailing-year range, the low is the bottom. At a high, no buyer from the past year is underwater. At a low, most are, which creates overhead supply that caps rallies.
Should beginners trade 52-week-high breakouts?
It's one of the more learnable setups because the entry and stop are objective. Paper trade 20 setups first, then go live risking no more than 1% of the account per trade.
Do analysts agree that 52-week-high stocks keep rising?
Often not. Fortinet traded near $180.95 while the analyst consensus was "Hold" with an average target of $152.79. Momentum and analyst valuation views can diverge for long stretches.
What confirms a valid 52-week-high breakout?
Above-average volume on the breakout day, a prior consolidation of roughly three weeks or more, and a logical stop level close enough that the trade's risk-reward works.
Why do 52-week-high breakouts fail?
Thin volume, no prior base, an extended entry far above support, a choppy broader tape, or an earnings report landing mid-trade. Failed breakouts that reverse hard are called bull traps.
Are 52-week-high stocks always expensive?
No. A stock can make new highs while its valuation multiple contracts, which happens when earnings grow faster than the share price. Check forward P/E against the sector median rather than assuming.
References
Nineteen Stocks Cleared Fresh 52 Week Highs This Week And H Hpe Price Extreme - https://247wallst.com/cards/nineteen-stocks-cleared-fresh-52-week-highs-this-week-and-h-hpe-price-extreme-01m411bg7m47nrkd73xxk9e5r9
1 Momentum Stock Research Further - https://finance.yahoo.com/markets/stocks/articles/1-momentum-stock-research-further-102203007.html
Near 52 Week High - https://www.money365.market/screener/near-52-week-high
52 Week High - https://public.com/markets/52-week-high
52 Week Highs - https://stockmarketwatch.com/screen/52-week-highs
52 Week High Stocks Today - https://www.wallstreetzen.com/stock-screener/52-week-high-stocks-today
52 Week Highs And Lows - https://www.strasmore.com/blog/52-week-highs-and-lows
Weekly Traders Outlook - https://www.schwab.com/learn/story/weekly-traders-outlook
Stocks That Could Rally - https://www.kiplinger.com/investing/stocks/stocks-that-could-rally
New Fifty-Two Week Highs and Lows - https://www.wsj.com/market-data/stocks/newfiftytwoweekhighsandlows