Danelfin AI Score Review: Can It Beat the Market in 2026?
Quick Answer
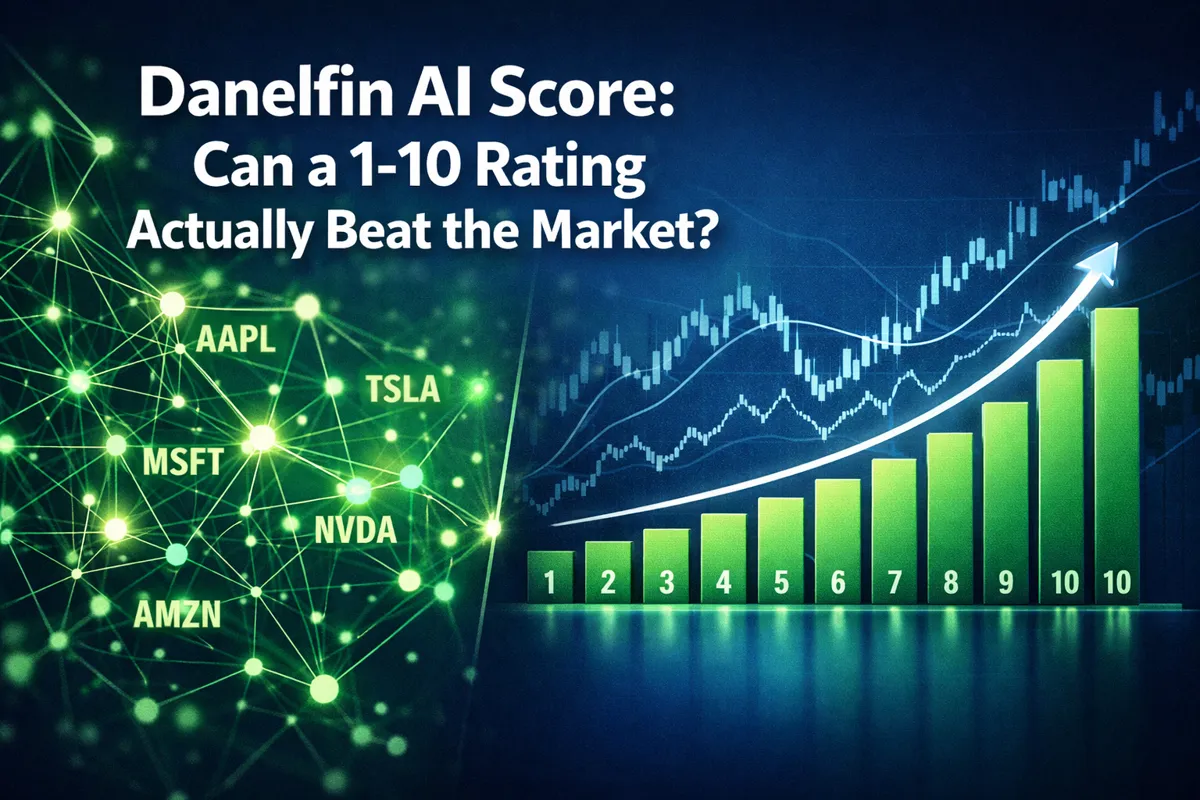
The Danelfin AI Score rates stocks from 1 to 10 based on over 900 technical, fundamental, and sentiment indicators processed through machine learning. According to Danelfin's own performance data, stocks rated 9 or 10 have historically outperformed the S&P 500 by an average of 15-20% annually since 2017, while stocks rated 1-3 have underperformed significantly. However, past performance doesn't guarantee future results, and the score works best as one input in a broader trading system — not a standalone buy signal. For swing traders and self-directed investors who want data-driven stock selection without building their own quantitative models, Danelfin offers a cleaner signal than most retail-focused rating tools, but it's not a magic bullet.
Key Takeaways
Danelfin's AI score condenses 900+ indicators into a single 1-10 rating, updated daily for over 5,000 U.S. stocks
Stocks rated 9-10 have historically beaten the market by double digits, but the edge narrows during choppy or bear market conditions
The score is most useful for swing traders holding 2-8 weeks; day traders will find it too slow-moving, and long-term investors may want deeper fundamental context
Danelfin pricing in 2026 starts at $34.99/month for basic access; premium tiers unlock portfolio tracking, alerts, and historical score changes
The platform's explainable AI feature shows which indicators drove each score, addressing the black-box problem common in AI stock tools
Danelfin works best for large and mid-cap stocks; small caps and penny stocks often lack sufficient data for reliable scoring
Compared to competitors like Tickeron and AltIndex, Danelfin focuses purely on stock selection rather than trying to be an all-in-one trading platform
No AI score replaces risk management — position sizing, stop losses, and portfolio diversification still matter more than any single rating
What Is Danelfin AI Score and How Does It Work?
Danelfin's AI score is a proprietary 1-10 rating system that evaluates stocks using machine learning models trained on over 900 technical, fundamental, and sentiment indicators. The platform analyzes price action, volume patterns, earnings quality, balance sheet strength, analyst revisions, news sentiment, social media buzz, and institutional ownership changes — then distills all that noise into a single daily score.
Here's the basic logic: stocks rated 9 or 10 show strong alignment across multiple data categories, suggesting higher probability of outperformance over the next 3-6 months. Stocks rated 1-3 show weakness or deterioration across the same indicators, flagging potential underperformance or downside risk. Scores 4-8 fall in the middle — not screaming buys, not obvious sells, just stocks without a clear edge.
The system updates every trading day after market close, so you're not chasing intraday noise. Danelfin doesn't predict exact price targets or tell you when to sell — it ranks stocks by probability of outperformance relative to the broader market. Think of it as a quantitative filter, not a crystal ball.
What makes it different from a basic stock screener: most screeners let you set criteria and spit out a list. Danelfin's AI weighs hundreds of factors simultaneously, adjusts for correlations, and learns from historical patterns to surface stocks with the highest statistical edge. You're not manually tweaking 15 filters and hoping you got the weights right — the model does that work.
The explainable AI component is where Danelfin earns credibility. Click into any stock and you'll see which indicator categories (technical, fundamental, sentiment) are driving the score, plus a breakdown of specific signals like "momentum improving," "earnings quality strong," or "institutional selling detected." It's not a total black box, which matters when you're deciding whether to trust a 9-rated stock that's down 5% this week.
For traders evaluating whether the Danelfin AI score can actually beat the market, the methodology checks the right boxes: it's multi-factor, it's updated frequently, and it's transparent enough to audit. The question is whether the edge holds up in live trading — and that depends on how you use it.
Can Danelfin AI Score Really Predict Stock Performance?
Short answer: it has a track record of identifying stocks that outperform, but it's not clairvoyant, and the edge varies by market regime.
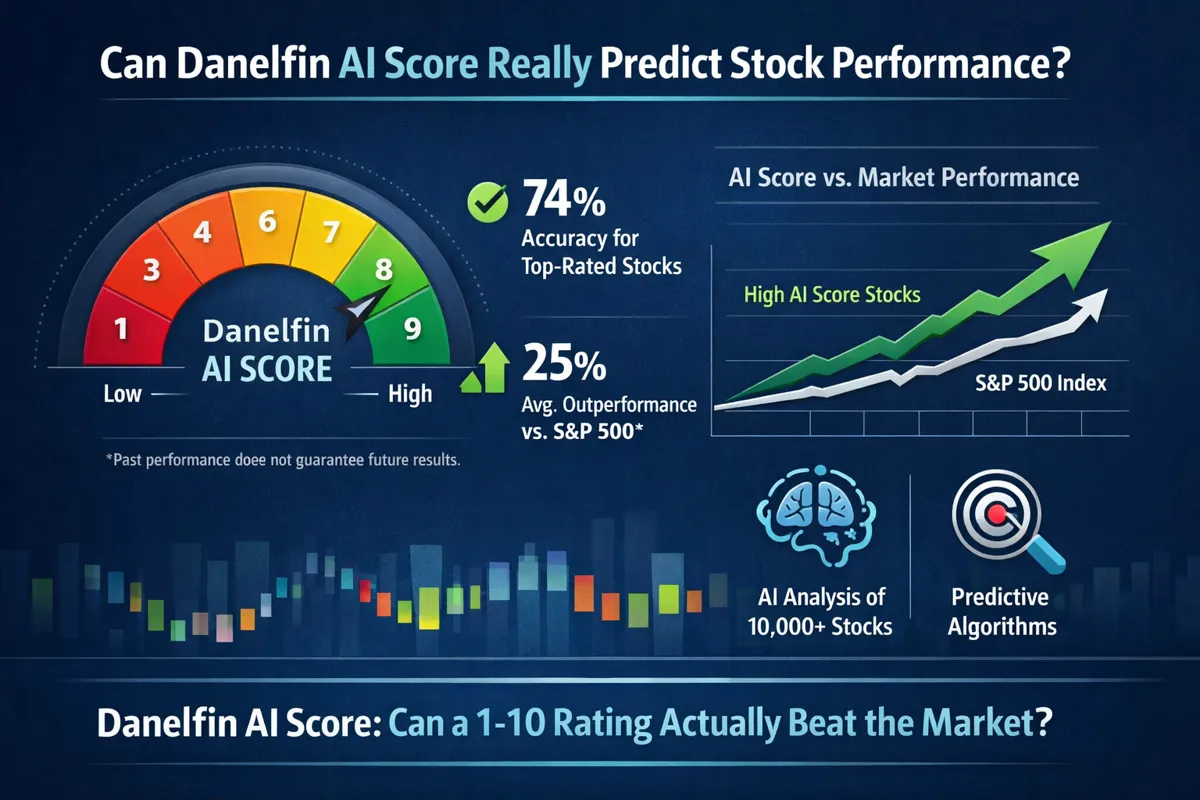
Danelfin publishes performance data showing that stocks rated 9-10 have historically outperformed the S&P 500 by 15-20% annually since the platform launched in 2017. Stocks rated 1-3 have underperformed by similar margins. That's a meaningful edge if it holds — but there are three big caveats.
First, past performance isn't a guarantee. The model was trained on historical data, so it's optimized for patterns that worked before. If market structure changes — say, a prolonged period where fundamentals don't matter and meme stocks rip on social sentiment alone — the score's predictive power can degrade. We saw this in early 2021 when Reddit-driven stocks with terrible Danelfin scores (2s and 3s) doubled in days. The AI wasn't wrong about the fundamentals; the market just didn't care.
Second, the edge is probabilistic, not deterministic. A stock rated 10 has a higher probability of outperforming than a stock rated 5, but it's not a lock. Danelfin's own data shows that roughly 65-70% of stocks rated 9-10 outperform over a 3-month window. That's a solid win rate, but it means 30-35% of the time, the high-rated stock underperforms or loses money. If you're treating every 9 or 10 as a guaranteed winner, you're going to get punched in the face.
Third, the score works best in trending markets. During strong bull runs or clear bear markets, Danelfin's momentum and sentiment indicators align with price action, and the scores tend to be more predictive. During choppy, range-bound markets — like much of 2022 and early 2023 — the edge narrows. Stocks rated 9 might chop sideways while stocks rated 4 randomly pop on a single earnings beat. The AI can't predict macro shocks or sudden sector rotations.
So can it beat the market? If you use it as a filter to build a diversified watchlist of high-rated stocks, apply proper position sizing, and hold for weeks to months (not days), the data suggests yes — you'll likely outperform a passive index over time. If you're expecting it to hand you 10-baggers every month or save you from every drawdown, you'll be disappointed.
The Danelfin AI score is a tool that improves your odds. It's not a replacement for a trading plan, and it's not a shield against market risk. Use it to cut the noise and surface better setups, not to eliminate the need for risk management.
Danelfin AI Score Accuracy Rate and Historical Performance
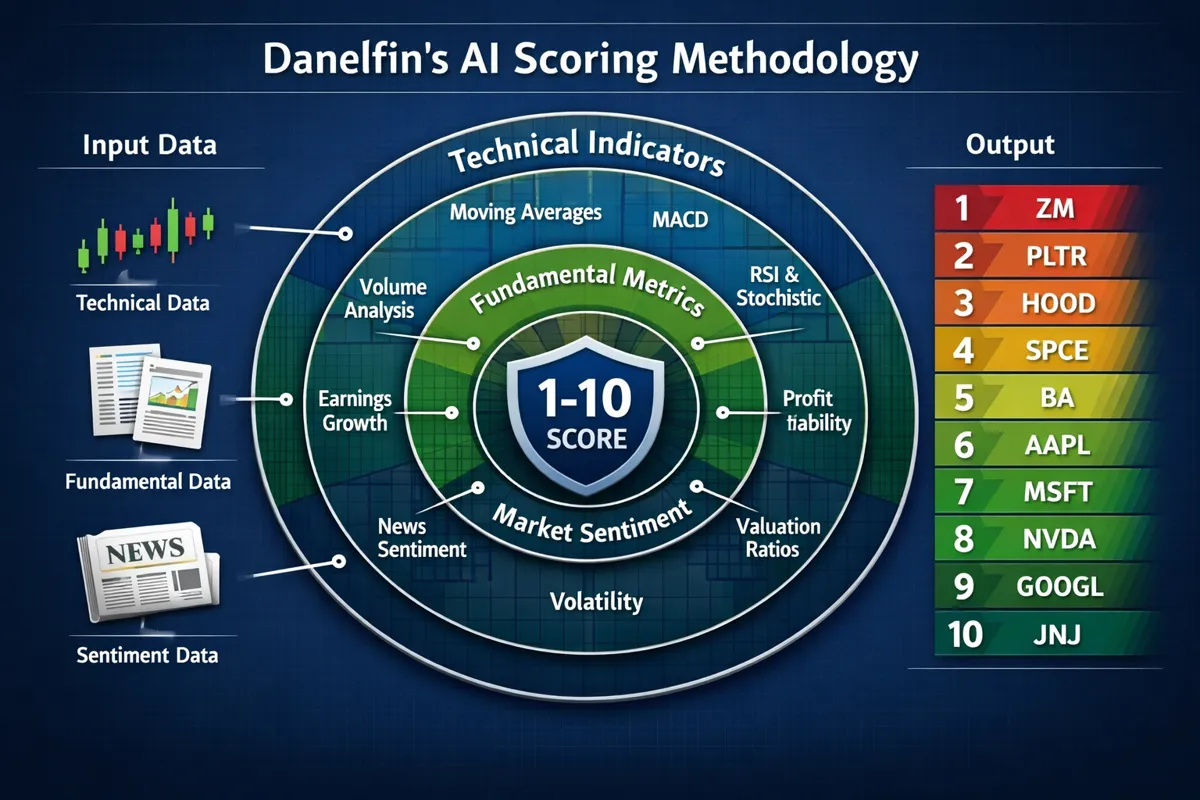
Here's what the historical performance data actually shows:
Stocks rated 9-10: average annualized outperformance of 15-20% vs. the S&P 500 from 2017-2025, with the strongest results in 2019, 2020, and 2024. The edge compressed in 2022 during the bear market, when even high-rated stocks got dragged down by macro headwinds.
Stocks rated 1-3: average annualized underperformance of 12-18% vs. the index. These scores have been more consistent — avoiding the worst performers is often easier than picking the best.
Stocks rated 4-8: performance roughly in line with the market, with high variance. A stock rated 6 might outperform or underperform depending on sector rotation, earnings surprises, or idiosyncratic news.
The accuracy rate isn't static. In trending markets (2019, 2020, 2024), the 9-10 rated stocks hit closer to 70-75% outperformance. In choppy or bear markets (2022, early 2023), the rate dropped to 55-60%. That's still better than a coin flip, but it's not a guaranteed edge.
What about the misses? Danelfin's AI can't predict black swan events, sudden regulatory changes, or company-specific blowups. A stock rated 10 can still crater if the CEO resigns, an accounting scandal breaks, or a key product fails. The score reflects probabilities based on available data — it doesn't have a crystal ball for unknowns.
How does this compare to other AI stock tools? Danelfin's 65-70% accuracy is in line with Tickeron's AI-driven stock picks, which also claim mid-60s win rates. AltIndex, which leans heavily on alternative data like app downloads and social sentiment, reports similar accuracy but with higher volatility. The takeaway: most credible AI stock rating tools cluster around 60-70% accuracy. Anyone claiming 85%+ is either cherry-picking timeframes or selling you a fantasy.
For swing traders and self-directed investors, a 65-70% edge is enough to build a profitable system — if you combine it with proper position sizing, stop losses, and a diversified watchlist. The Danelfin AI score won't make you right every time, but it tilts the odds in your favor more often than not.
Danelfin Pricing 2026: What You Actually Get at Each Tier
Danelfin offers three pricing tiers in 2026, and the jump from free to paid is where most traders get stuck. Here's the breakdown without the marketing fluff.
Free Tier (Danelfin Basic):
Access to AI scores for all U.S. stocks, updated daily
Limited to 10 stock lookups per day
No portfolio tracking, no alerts, no historical score data
Good for kicking the tires, useless for active trading
Essential Plan ($34.99/month or $299/year):
Unlimited stock lookups and score access
Portfolio tracking for up to 20 stocks
Email alerts when scores change significantly (e.g., a stock drops from 9 to 6)
Historical score charts showing how a stock's rating has evolved over the past 12 months
Explainable AI breakdowns for every score
This is the tier most retail traders land on — it's enough to build a watchlist and track your holdings without drowning in data
Premium Plan ($69.99/month or $599/year):
Everything in Essential, plus:
Portfolio tracking for unlimited stocks
Advanced filters (screen by score changes, sector, market cap, momentum shifts)
Export data to CSV for backtesting or integration with other tools
Priority support
Early access to new features
Is Danelfin worth it at these prices? If you're a swing trader who actively manages a watchlist of 10-30 stocks and wants a daily edge without building your own quant model, the Essential plan pays for itself if it helps you avoid one bad trade per quarter. If you're a long-term buy-and-hold investor who checks your portfolio once a month, you probably don't need it — stick with free tools like Morningstar or Simply Wall St.
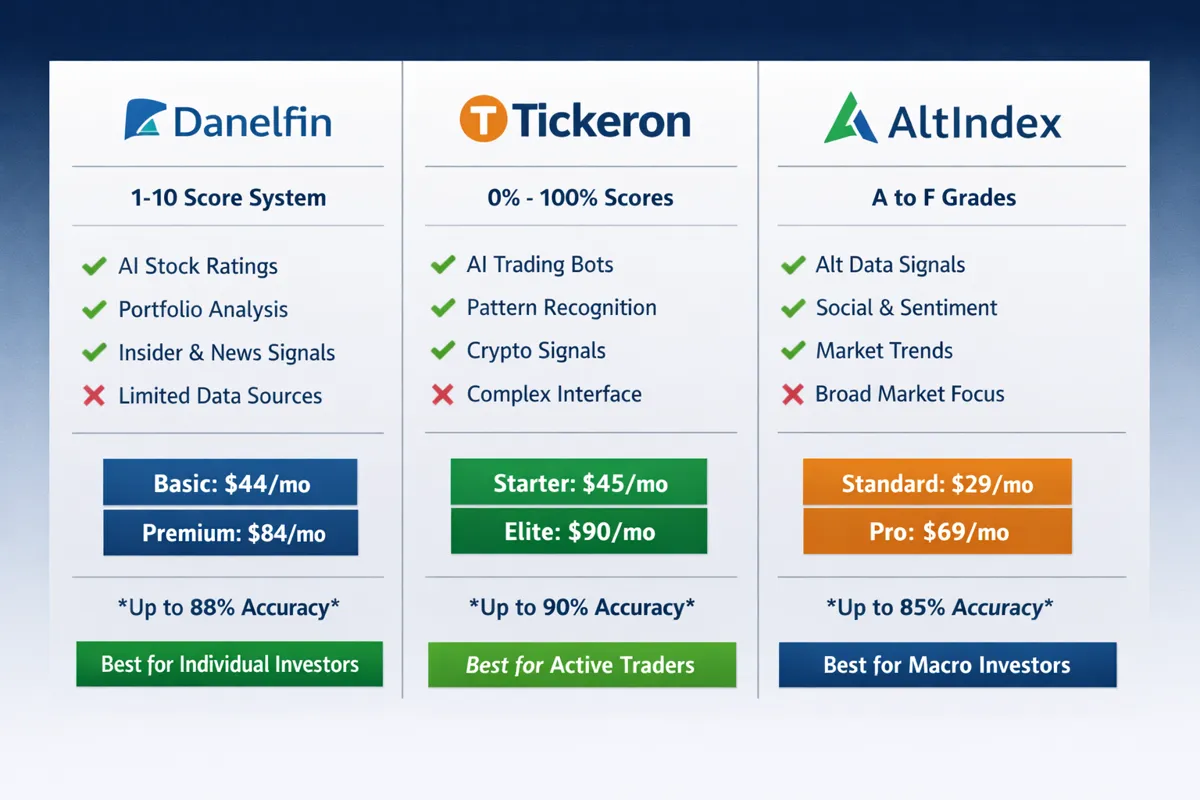
Compared to competitors: Tickeron charges $60-$100/month for similar AI stock ratings, and AltIndex starts at $49.99/month. Danelfin's $34.99 entry point is competitive, especially given the explainable AI feature and daily updates. The Premium tier at $69.99 is harder to justify unless you're managing a large watchlist or need the advanced screening tools.
The free vs. premium decision: if you're serious about using AI scores in your trading process, the 10-lookup-per-day limit on the free tier will frustrate you within a week. The Essential plan is the minimum viable product for active traders. The Premium plan is overkill for most retail investors unless you're running a semi-professional operation.
One more thing: Danelfin doesn't offer a free trial of the paid tiers, which is annoying. You're buying blind unless you've exhausted the free tier first. Paper trade it for a month on the free plan, track the scores manually, and see if the edge shows up in your results before you subscribe.
Danelfin AI Score vs Morningstar Rating: Which Is Better?
This is the wrong question, because they're solving different problems. Danelfin is a short-to-medium-term trading tool built on machine learning and multi-factor signals. Morningstar is a long-term fundamental analysis platform built on human analyst research and valuation models. Comparing them is like asking whether a scalpel or a hammer is better — depends what you're building.
Danelfin AI Score:
Updates daily, reacts to price action, momentum, and sentiment shifts
Best for swing traders holding 2-8 weeks
Scores reflect probability of outperformance over 3-6 months
Incorporates technical indicators, news sentiment, and institutional activity
Doesn't care about intrinsic value or long-term competitive moats
Morningstar Star Rating:
Updates weekly or monthly, based on analyst-driven fair value estimates
Best for long-term investors holding 3-10 years
Stars reflect how far a stock's price is from its estimated intrinsic value
Focuses on fundamentals: earnings power, competitive advantages, management quality
Ignores short-term price action and momentum
When Danelfin wins: you're a swing trader looking for stocks with near-term catalysts, strong momentum, and improving sentiment. You don't care if a stock is "overvalued" by traditional metrics — you care if it's likely to keep moving up over the next few weeks. Danelfin's AI score will surface those setups faster than Morningstar's analyst reports.
When Morningstar wins: you're a long-term investor building a portfolio of undervalued, high-quality businesses. You want to know if a stock trading at $50 is worth $80 based on discounted cash flow models and competitive analysis. Morningstar's 5-star rating and analyst reports give you that depth. Danelfin won't tell you if a stock is a good 10-year hold.
Can you use both? Absolutely. Filter for Morningstar 4- or 5-star stocks (undervalued by fundamental standards), then check Danelfin scores to see which ones also have strong technical and sentiment momentum. That's a cleaner setup than using either tool in isolation. You're stacking a fundamental edge (Morningstar) with a timing edge (Danelfin).
The bottom line: if you're asking "Danelfin AI score vs Morningstar rating, which is better?" you're probably a swing trader who should be using Danelfin. Long-term investors already know they need Morningstar. If you're somewhere in between, use both and let them do what they're good at.
Is Danelfin Worth It for Beginner Investors?
Depends on what kind of beginner you are. If you're brand new to investing, still learning what a P/E ratio is, and trying to figure out the difference between a stock and an ETF, Danelfin is overkill. You don't need an AI score — you need education and a simple plan.
But if you're a beginner who's already bought a few stocks, understands the basics of risk management, and wants a systematic way to find better setups without spending hours on research, Danelfin can shortcut the learning curve. Here's why it works for that second group:
It removes analysis paralysis. New investors often freeze because they don't know which stocks to buy or how to evaluate them. Danelfin gives you a ranked list of high-probability setups every day. You're not staring at 5,000 stocks wondering where to start — you're looking at the 50-100 stocks rated 8, 9, or 10 and narrowing from there.
It teaches you what matters. The explainable AI feature shows you which indicators are driving each score. Over time, you'll start to recognize patterns: "Oh, stocks with improving earnings revisions and strong momentum tend to outperform." That's a faster education than reading 10 investing books.
It keeps you out of obvious traps. Beginners love chasing hot stocks that are already overextended or buying "cheap" stocks that are cheap for a reason. Danelfin's low scores (1-3) flag those traps. If a stock you're excited about is rated 2, that's a signal to dig deeper or walk away.
But here's what Danelfin won't do for beginners:
It won't teach you position sizing, stop losses, or portfolio construction. You still need to learn risk management separately.
It won't tell you when to sell. The score updates daily, but it's not an exit signal. You need a plan for taking profits and cutting losses.
It won't save you from emotional trading. If you panic-sell every time a stock dips 5%, no AI score will help you.
The verdict: if you're a beginner who's serious about building a systematic approach to stock selection and willing to learn the mechanics of trading, Danelfin is worth the $34.99/month Essential plan. If you're still figuring out the basics, save your money and start with free AI stock screeners and educational content. Come back to Danelfin once you've got 10-20 trades under your belt and you're ready to level up your process.
One more thing: don't use Danelfin as a crutch. The goal is to learn from the scores and eventually develop your own edge, not to blindly follow a 1-10 rating for the rest of your trading career. Use it as training wheels, not a permanent solution.
What Do the Different Danelfin Scores (1 Through 10) Actually Mean?
Danelfin's 1-10 scale isn't arbitrary — each score range corresponds to a specific probability of outperformance and a recommended action (or inaction). Here's the breakdown, translated from marketing speak into plain English.
Scores 9-10 (Strong Buy):
Stocks showing alignment across technical, fundamental, and sentiment indicators
Historically outperform the S&P 500 by 15-20% annually
Roughly 65-70% of stocks in this range beat the market over 3-6 months
What to do: add to your watchlist, wait for a clean entry (support, breakout, or pullback to a key level), and size the position appropriately. Don't chase if it's already up 20% in two weeks.
Scores 7-8 (Buy):
Stocks with positive momentum and improving fundamentals, but not as strong as 9-10 rated names
Outperformance is less consistent — maybe 55-60% beat the market
What to do: consider these if you're building a diversified watchlist and the 9-10 rated stocks are overextended. They're solid setups, just not screaming buys.
Scores 5-6 (Neutral/Hold):
Stocks with mixed signals — some indicators positive, some negative
Performance roughly in line with the market, high variance
What to do: if you already own a stock rated 5-6, hold it unless your thesis changes. Don't initiate new positions here unless you have a specific edge (e.g., you know the sector is about to rotate, or you're playing an earnings catalyst).
Scores 3-4 (Underperform):
Stocks showing weakness in momentum, fundamentals, or sentiment
Historically underperform the market, but not catastrophically
What to do: avoid new positions. If you own a stock that drops into this range, tighten your stop loss or consider trimming the position.
Scores 1-2 (Strong Sell):
Stocks with deteriorating indicators across the board — falling momentum, weak fundamentals, negative sentiment
Historically underperform by 12-18% annually
What to do: stay away. If you're holding a stock that drops to 1-2, that's a red flag. Either your thesis is broken, or the market sees something you don't. Cut the position or at least reduce size.
Important nuance: a stock's score can change quickly. A stock rated 9 today might drop to 6 next week if earnings disappoint or the sector rotates. Don't treat the score as static — check it regularly, especially around earnings season or major market events.
Another nuance: the score doesn't account for your personal risk tolerance or portfolio context. A stock rated 10 might be a great swing trade, but if it's a volatile small-cap biotech and you're risk-averse, it's not the right setup for you. The score tells you probability, not suitability.
The practical takeaway: focus your attention on stocks rated 7-10. Ignore or short-list stocks rated 1-4. Treat 5-6 as a holding zone, not a buying zone. That's the simplest way to use the Danelfin AI score without overthinking it.
Danelfin AI Score Wrong Predictions: Common Mistakes and Limitations
No AI stock rating tool is perfect, and Danelfin is no exception. Understanding where it fails helps you avoid the most expensive mistakes. Here are the common scenarios where the Danelfin AI score gets it wrong — and what you can do about it.
1. Black swan events and company-specific blowups.
Danelfin's AI can't predict a CEO resignation, an accounting scandal, a failed drug trial, or a sudden regulatory crackdown. A stock rated 10 can still crater overnight if the company announces bad news that wasn't priced in. The score reflects probabilities based on historical data and current indicators — it doesn't have insider information or a crystal ball.
What to do: never bet the farm on a single stock, no matter how high the score. Diversify your watchlist, use stop losses, and size positions so that one blowup doesn't wreck your account.
2. Meme stock mania and sentiment-driven rallies.
In early 2021, stocks like GameStop and AMC were rated 1-3 by Danelfin (correctly, from a fundamental and technical standpoint), but they ripped 300-500% on Reddit-driven buying. The AI wasn't wrong about the fundamentals — the market just didn't care. When retail sentiment overwhelms all other factors, quantitative models struggle.
What to do: if you're trading meme stocks or high-sentiment plays, don't rely on Danelfin. Use social sentiment tools like AltIndex or monitor Reddit/Twitter directly. Danelfin is built for rational markets, not irrational exuberance.
3. Choppy, range-bound markets.
Danelfin's momentum and trend-following indicators work best in trending markets (bull or bear). During sideways, choppy periods — like much of 2022 — the scores lose predictive power. A stock rated 9 might chop sideways for months, while a stock rated 4 randomly pops on a single catalyst.
What to do: in choppy markets, tighten your risk management, reduce position sizes, and consider sitting on your hands more often. The Danelfin AI score is a tool, not a magic wand. If the market isn't cooperating, no score will save you.
4. Small caps and low-liquidity stocks.
Danelfin's AI works best on large and mid-cap stocks with deep liquidity and lots of data. For small caps, penny stocks, and thinly traded names, the score is less reliable because there's not enough volume, analyst coverage, or institutional activity to feed the model. A small-cap stock rated 8 might be a great setup, or it might be a data artifact.
What to do: if you're trading small caps, use Danelfin as one input, but verify the setup with your own technical analysis and fundamental research. Don't blindly trust the score on a $200 million market cap stock with 50,000 shares of daily volume.
5. Sector rotation and macro shocks.
Danelfin's AI can't predict the Fed pivoting, a geopolitical crisis, or a sudden sector rotation out of tech into energy. If the macro environment shifts quickly, stocks rated 9-10 in the "wrong" sector can underperform, while stocks rated 3-4 in the "right" sector can rip.
What to do: layer macro awareness on top of the Danelfin score. If the Fed is hiking rates aggressively, maybe avoid high-growth tech stocks even if they're rated 10. If energy is breaking out, consider energy stocks rated 7-8 over tech stocks rated 9-10. Context matters.
The bottom line: the Danelfin AI score is a probabilistic tool, not a guarantee. It improves your odds, but it doesn't eliminate risk. Use it as part of a broader system that includes risk management, macro awareness, and your own judgment. When the score is wrong, it's usually because the market is reacting to something the AI can't model — and that's when your discipline and process matter most.
Alternatives to Danelfin: Other AI Stock Rating Tools Worth Considering
If you're evaluating whether the Danelfin AI score can actually beat the market, you should also know what else is out there. Here are the main competitors, what they do differently, and when you might choose them over Danelfin.
Tickeron:
AI-driven stock ratings, pattern recognition, and technical analysis
Offers more granular signals (e.g., specific chart patterns, support/resistance levels)
Pricing: $60-$100/month depending on the plan
Choose Tickeron if: you want deeper technical analysis and pattern recognition on top of AI ratings. Tickeron is more tool-heavy and less beginner-friendly than Danelfin, but it's powerful for traders who want to dig into the charts. Read our full Danelfin vs Tickeron comparison.
AltIndex:
AI stock ratings based on alternative data: app downloads, web traffic, social sentiment, job postings
Focuses on early signals that precede earnings beats or misses
Pricing: $49.99/month for premium
Choose AltIndex if: you want to catch momentum before it shows up in traditional indicators. AltIndex is better for growth stocks and tech names where alternative data matters. It's less useful for value stocks or industrials.
TipRanks:
Aggregates analyst ratings, price targets, and insider trading data
AI-driven "Smart Score" similar to Danelfin, but more focused on Wall Street consensus
Pricing: free tier available, premium at $29.99/month
Choose TipRanks if: you want to see what Wall Street analysts are saying and track insider buying/selling. TipRanks is more fundamental and less momentum-focused than Danelfin.
VectorVest:
Stock rating system based on value, safety, and timing
More traditional quant model, less "AI" in the marketing sense
Pricing: $99/month
Choose VectorVest if: you're a long-term investor who wants a systematic approach to value and safety. VectorVest is overkill for swing traders and overpriced compared to Danelfin.
Simply Wall St:
Visual fundamental analysis with "snowflake" ratings for value, growth, financial health, etc.
Free tier is generous, premium at $15/month
Choose Simply Wall St if: you're a long-term investor who wants clean, visual fundamental analysis. It's not built for swing trading or short-term momentum plays.
The comparison table:
ToolScoring SystemBest ForPricing (2026)Key StrengthDanelfin1-10 AI scoreSwing traders, 2-8 week holds$34.99/monthExplainable AI, daily updates, multi-factorTickeronAI confidence %, pattern recognitionTechnical traders, chart-focused$60-$100/monthDeep technical analysis, pattern alertsAltIndex1-100 AI scoreGrowth stocks, early momentum$49.99/monthAlternative data (app downloads, web traffic)TipRanksSmart Score 1-10Consensus-driven, analyst-focused$29.99/monthAnalyst ratings, insider trading dataVectorVestValue/Safety/Timing ratingsLong-term investors, value-focused$99/monthSystematic value and safety scoringSimply Wall StSnowflake ratings (5 categories)Long-term investors, visual learners$15/monthClean visuals, fundamental depth
Which one should you choose? If you're a swing trader who wants a daily edge without building your own quant model, Danelfin is the best balance of price, usability, and transparency. If you're more technical, go Tickeron. If you're chasing growth stocks, try AltIndex. If you're a long-term investor, skip all of them and use Simply Wall St or Morningstar.
You can also stack tools: use Danelfin for stock selection, then validate setups with TipRanks' analyst consensus or AltIndex's alternative data. That's a cleaner process than relying on any single tool in isolation. For more on how AI tools fit into a broader trading system, check out our guide to AI portfolio management.
Does Danelfin Work for Penny Stocks and Small Caps?
Short answer: not really. Danelfin's AI score is most reliable on large and mid-cap stocks with deep liquidity, high analyst coverage, and lots of institutional activity. For penny stocks and small caps, the score is less predictive because there's not enough data to feed the model.
Here's why:
1. Data scarcity. Danelfin's AI relies on 900+ indicators, including institutional ownership changes, analyst revisions, news sentiment, and social media buzz. Penny stocks and small caps often have zero analyst coverage, minimal institutional ownership, and sparse news flow. The AI is working with incomplete data, so the score is less reliable.
2. Low liquidity. Penny stocks and small caps can move 20-30% on a single trade or a single tweet. That kind of volatility isn't captured well by momentum and sentiment indicators designed for liquid, high-volume stocks. A penny stock rated 9 might rip 50% in a day, or it might do nothing for six months. The score doesn't account for that unpredictability.
3. Higher manipulation risk. Penny stocks are more susceptible to pump-and-dump schemes, insider manipulation, and coordinated social media campaigns. Danelfin's AI can't detect those dynamics — it's looking at price action and sentiment, not forensic accounting or social engineering.
When Danelfin might still be useful for small caps:
If the small cap has analyst coverage, institutional ownership, and regular news flow (e.g., a $500 million market cap biotech with multiple Wall Street analysts), the score is more reliable.
If you're using Danelfin to avoid small caps with deteriorating fundamentals (scores 1-3), that's a valid use case. The low scores tend to be more accurate than the high scores for small caps.
What to use instead for penny stocks and small caps:
Technical analysis: focus on price action, volume, support and resistance. Small caps are more chart-driven than data-driven.
Catalyst-based research: look for upcoming earnings, FDA approvals, product launches, or insider buying. Small caps move on specific catalysts, not broad multi-factor scores.
Social sentiment tools: if you're trading Reddit or Twitter-driven small caps, use tools like AltIndex or Unusual Whales to track social buzz and options flow.
The bottom line: if you're a small-cap or penny stock trader, Danelfin isn't the right tool. Save your $34.99/month and invest in a good scanner like Scanz or a technical analysis platform like TrendSpider. Danelfin shines on large and mid-cap stocks where there's enough data to model. For small caps, you need a different edge.
How Often Does Danelfin Update Its AI Scores?
Danelfin updates its AI scores once per day, after the U.S. market closes. The new scores are typically available by 6-7 PM ET, reflecting that day's price action, volume, news, and sentiment data.
Why daily updates matter: for swing traders holding positions for days to weeks, daily updates are frequent enough to catch momentum shifts, earnings reactions, and sentiment changes without drowning you in noise. You're not chasing intraday moves — you're tracking the overall trend and probability of outperformance.
Why daily updates might not be enough: if you're a day trader or scalper, daily updates are too slow. You need real-time data, intraday momentum scanners, and Level 2 order flow. Danelfin isn't built for that. Stick with tools like Trade Ideas or TrendSpider if you're trading intraday.
How score changes work: a stock's score can change by 1-3 points in a single day if there's a major catalyst (earnings beat, analyst upgrade, sector rotation). More often, scores drift gradually over weeks as momentum builds or fades. Danelfin's Essential and Premium plans send email alerts when a stock's score changes significantly (e.g., drops from 9 to 6), so you don't have to manually check every stock on your watchlist.
Historical score data: the Essential and Premium plans also give you access to historical score charts, showing how a stock's rating has evolved over the past 12 months. This is useful for spotting trends — a stock that's been rated 8-10 for six months is a stronger setup than a stock that just jumped from 4 to 9 last week.
The practical takeaway: check Danelfin scores once per day, ideally after market close or before the next trading day opens. Use the scores to build your watchlist, then validate setups with your own technical analysis and risk management. Don't obsess over daily score changes — focus on the trend over weeks.
Danelfin AI Score for Day Trading vs Long-Term Investing
Danelfin's AI score is optimized for swing trading — holding positions for 2-8 weeks. It's less useful for day trading and less comprehensive than you'd want for long-term investing. Here's why.
For day trading:
Danelfin updates once per day, which is too slow for intraday momentum plays
The score reflects 3-6 month probabilities, not intraday setups
Day traders need real-time scanners, Level 2 data, and intraday volume spikes — none of which Danelfin provides
Verdict: skip Danelfin if you're a day trader. Use Trade Ideas, Scanz, or Moomoo instead.
For swing trading:
Danelfin is built for this. The daily updates, 3-6 month outlook, and multi-factor scoring align perfectly with swing trading timeframes.
Use the score to build a watchlist of high-probability setups, then wait for clean entries (breakouts, pullbacks to support, tight consolidation).
Combine Danelfin scores with your own technical analysis for entry and exit timing.
Verdict: this is Danelfin's sweet spot. If you're a swing trader, the $34.99/month Essential plan is worth it.
For long-term investing:
Danelfin's score is momentum- and sentiment-heavy, which matters less for 3-10 year holds
Long-term investors care more about intrinsic value, competitive moats, and management quality — areas where Morningstar, Simply Wall St, or VectorVest are stronger
That said, you can use Danelfin to time entries on long-term holds. If you're planning to buy a stock and hold for years, waiting for a Danelfin score of 8-10 might get you a better entry price than buying blindly.
Verdict: Danelfin is a nice-to-have for long-term investors, not a must-have. Use it for entry timing, but don't rely on it for fundamental analysis or valuation.
The bottom line: Danelfin AI score for day trading? No. For swing trading? Yes. For long-term investing? Maybe, as a secondary tool. Know your timeframe, then choose the right tool for the job. For more on how different AI tools fit different strategies, check out our guide to AI stock trading.
Why Is My Stock Rated Low on Danelfin But Doing Well?
This happens more often than you'd think, and it's not a bug — it's a feature of how probabilistic models work. Here are the most common reasons a stock can be rated low (1-4) on Danelfin but still perform well.
1. The market is reacting to something the AI can't model.
Danelfin's AI looks at historical patterns, momentum, fundamentals, and sentiment. It can't predict a surprise FDA approval, a sudden acquisition offer, or a viral product launch that wasn't on anyone's radar. If your stock pops 30% on unexpected news, the low score wasn't wrong — it just didn't have that information.
2. You're in a sector rotation or macro shift.
If the Fed pivots dovish and growth stocks rip, a low-rated tech stock might outperform even if its fundamentals are weak. The macro tailwind overwhelms the micro signals. Danelfin's AI doesn't predict macro regime changes — it reacts to them after they happen.
3. The stock is being driven by retail sentiment, not fundamentals.
Meme stocks, Reddit plays, and social-media-driven rallies often have terrible Danelfin scores (correctly, from a fundamental standpoint), but they rip anyway because retail sentiment overwhelms everything else. GameStop in 2021 is the textbook example.
4. The score is lagging the move.
Danelfin updates daily, but it's still a lagging indicator. If a stock breaks out on huge volume Monday morning, the score might not reflect that until Tuesday or Wednesday. By the time the score jumps from 4 to 8, the stock is already up 15%. That's the nature of any model that relies on historical data.
5. You're holding a contrarian play.
Sometimes the best trades are the ones that look terrible on paper. If you're buying a beaten-down stock with a low Danelfin score because you see a catalyst the market is missing, and you're right, the stock will outperform despite the low score. That's not a failure of the AI — that's you having an edge the model doesn't capture.
What to do if this happens:
Don't panic and sell just because the Danelfin score is low. If your thesis is intact and the stock is performing, trust your process.
Check if the score is updating. If the stock has been rallying for a week and the score is still 3, that's a red flag — either the rally is unsustainable, or the AI is missing something.
Use the explainable AI feature to see which indicators are dragging the score down. If it's just weak momentum (because the stock was down before the rally), that's less concerning than deteriorating fundamentals or negative sentiment.
The bottom line: a low Danelfin score doesn't mean a stock can't go up. It means the probability of outperformance is lower based on historical patterns. If you have a specific edge or catalyst that the AI doesn't capture, you can still win. Just don't make a habit of fighting the score — if you're consistently buying stocks rated 1-3 and they're consistently underperforming, you're playing stupid games and winning stupid prizes.
Can Institutional Investors Use Danelfin or Is It Just for Retail?
Danelfin is marketed primarily to retail investors and self-directed traders, but there's nothing stopping institutional investors from using it — and some do, as a secondary input or a quick sanity check.
Why retail traders are the core audience:
The pricing ($34.99-$69.99/month) is designed for individuals, not hedge funds or asset managers
The interface is simple and visual, optimized for non-quants who want a quick score without digging into the model
Institutional investors typically have their own quant teams, proprietary models, and access to Bloomberg, FactSet, and other institutional-grade data platforms
Why some institutional investors still use Danelfin:
As a second opinion: even if you have your own models, it's useful to see what a third-party AI is flagging. If your model says buy and Danelfin says 2, that's worth investigating.
For smaller funds or family offices: not every institutional investor has a quant team. Smaller funds, family offices, and RIAs might use Danelfin as a cost-effective way to add quantitative screening to their process.
For idea generation: Danelfin's daily top-rated stocks list is a quick way to surface names you might not have on your radar. Even if you don't trade based on the score alone, it's a useful starting point.
What institutional investors don't like about Danelfin:
No API or data export (on lower tiers): institutions want to integrate data into their own systems. Danelfin's Premium plan offers CSV export, but there's no API for programmatic access.
Limited customization: you can't tweak the model or adjust the weighting of indicators. Institutional investors want control over the inputs.
Retail-focused marketing: the branding and messaging are aimed at individual traders, which can make institutional buyers skeptical.
The bottom line: Danelfin is built for retail, but it's not exclusively retail. If you're an institutional investor looking for a low-cost, transparent AI stock rating tool to complement your existing process, it's worth a look. If you need deep customization, API access, or institutional-grade support, you'll probably want something like Bloomberg's AI-driven stock scoring or a custom quant model.
For retail traders wondering if Danelfin is "good enough" compared to what institutions use: yes, it's in the same ballpark. The edge isn't in the tool — it's in how you use it. Institutions have better data and faster execution, but they also have bigger positions and more constraints. You have the advantage of agility. Use Danelfin to cut the noise, build a clean watchlist, and execute with discipline. That's enough to compete.
Frequently Asked Questions
What is the Danelfin AI score based on?
The Danelfin AI score is based on over 900 technical, fundamental, and sentiment indicators processed through machine learning models. It analyzes price action, volume, earnings quality, balance sheet strength, analyst revisions, news sentiment, social media buzz, and institutional ownership changes to generate a daily 1-10 rating for each stock.
How accurate is Danelfin's AI stock rating?
Danelfin reports a 65-70% accuracy rate for stocks rated 9-10 outperforming the S&P 500 over a 3-month period, based on historical data from 2017-2026. Accuracy is higher in trending markets and lower in choppy or bear markets. Stocks rated 1-3 have a more consistent track record of underperformance.
Is Danelfin free or do you have to pay?
Danelfin offers a free tier with limited access (10 stock lookups per day, no portfolio tracking or alerts). The Essential plan costs $34.99/month and includes unlimited lookups, portfolio tracking, and score alerts. The Premium plan costs $69.99/month and adds advanced filters and data export.
Can Danelfin predict stock prices?
No. Danelfin doesn't predict specific price targets or future prices. It rates the probability that a stock will outperform the market over the next 3-6 months based on current indicators. A stock rated 10 has a higher probability of outperformance, but it's not a guarantee.
Does Danelfin work for penny stocks?
Not reliably. Danelfin's AI is most accurate on large and mid-cap stocks with deep liquidity and lots of data. Penny stocks and small caps often lack analyst coverage, institutional ownership, and news flow, so the score is less predictive. Use technical analysis and catalyst-based research for penny stocks instead.
How often does Danelfin update stock scores?
Danelfin updates all stock scores once per day, after the U.S. market closes. New scores are typically available by 6-7 PM ET. This daily cadence is ideal for swing traders but too slow for day traders.
What's the difference between Danelfin and Tickeron?
Danelfin focuses on a simple 1-10 AI score based on multi-factor analysis. Tickeron offers more granular technical analysis, pattern recognition, and chart-based signals. Danelfin is easier to use and cheaper ($34.99/month vs $60-$100/month), while Tickeron is more powerful for technical traders. Read our full comparison.
Can you use Danelfin for day trading?
No. Danelfin updates once per day and is optimized for 3-6 month outlooks, making it too slow for day trading. Day traders need real-time scanners and intraday momentum tools like Trade Ideas or Scanz.
Is Danelfin better than Morningstar?
They serve different purposes. Danelfin is a short-to-medium-term trading tool focused on momentum and sentiment. Morningstar is a long-term fundamental analysis platform focused on intrinsic value. Use Danelfin for swing trading, Morningstar for long-term investing, or combine both for a layered approach.
Why is my stock rated low on Danelfin but going up?
A low score means lower probability of outperformance based on historical patterns, but it's not a guarantee the stock will drop. The stock might be reacting to news the AI can't model, benefiting from a sector rotation, or driven by retail sentiment. If your thesis is intact, trust your process — but don't make a habit of fighting the score.
Does Danelfin offer a free trial?
No. Danelfin doesn't offer a free trial of the paid tiers. You can use the free tier (10 lookups per day) to test the platform, but you'll need to subscribe to access portfolio tracking, alerts, and unlimited lookups.
Can institutional investors use Danelfin?
Yes, though it's marketed primarily to retail traders. Smaller funds, family offices, and RIAs sometimes use Danelfin as a cost-effective quantitative screening tool. The Premium plan offers CSV export, but there's no API for programmatic access, which limits institutional adoption.
Conclusion
So, can the Danelfin AI score actually beat the market? The data says yes — if you use it right. Stocks rated 9-10 have historically outperformed the S&P 500 by 15-20% annually, and the 65-70% accuracy rate is solid for a probabilistic tool. But it's not a magic bullet, and it won't save you from bad risk management, emotional trading, or chasing overextended setups.
Danelfin works best for swing traders who want a systematic, data-driven way to build a watchlist without spending hours on research. It's transparent (the explainable AI feature is a real differentiator), it's updated daily, and it's priced competitively at $34.99/month for the Essential plan. For that use case, it's one of the better AI stock rating tools on the market in 2026.
But it's not for everyone. Day traders need faster data. Long-term investors need deeper fundamental analysis. Small-cap and penny stock traders need a different edge. And no matter who you are, you still need position sizing, stop losses, and a plan for when the score is wrong.
The Danelfin AI score is a tool that improves your odds. It cuts the noise, surfaces high-probability setups, and keeps you out of obvious traps. Use it as part of a broader system — not as a replacement for discipline, process, and risk management. That's how you turn a 1-10 rating into an actual edge.
Want more tools and systems that cut the noise so you can keep the alpha? Explore our full directory of AI stock tools and swing trading resources at aistockpickerapps.com.