Discounted Cash Flow Formula: The 5-Minute Investor Guide

Last updated: September 22, 2026
Simply Wall St spits out a "fair value" number. FAST Graphs draws an orange line on a chart. Both of those numbers come from the same piece of math: the discounted cash flow formula. Most investors stare at that number, trust it, and have no idea how it got there.
That's the problem. A number you can't explain is a number you can't defend when the stock drops 20% and your app still says "undervalued." This piece breaks the discounted cash flow formula down to the version a working analyst actually uses, no finance degree required.
Quick Answer
The discounted cash flow formula estimates what a business is worth today by adding up its future free cash flow and shrinking each year's amount back to present-day dollars using a discount rate. The output is the company's intrinsic value, a number you compare against the current stock price to see if it's cheap, fair, or expensive. Every "fair value" score in Simply Wall St, FAST Graphs, or GuruFocus is a version of this same calculation running in the background.
Key Takeaways
- The discounted cash flow formula is the same math taught at Harvard Business School's valuation program, which restates DCF as the present value of future free cash flow discounted at the required rate of return.
- Among professional equity analysts, 78.8% use DCF models and 86.9% of those use discounted free cash flow specifically, according to CFA Institute's 2026 refresher reading.
- A 200-basis-point change in discount rate, from 12% down to 10%, pushed one example valuation from $12.73 to $16.21, a 27% swing, according to Investopedia's DCF pitfalls analysis.
- Typical discount rates used in DCF models cluster between 8% and 12%, tied to a company's WACC (Weighted Average Cost of Capital), per Investopedia's core DCF explainer.
- 92.8% of analysts use market multiples like P/E, more than the share using DCF, per the same CFA Institute data, which means most professionals use both, not one or the other.
- Stock Analysis launched a public DCF calculator with sensitivity tables on September 18, 2026, part of a wider trend of productizing this formula for retail investors, per SSRN research documentation.
- Terminal value routinely makes up the majority of a DCF's total output, which is exactly why small changes to growth and discount rate assumptions swing the "fair value" number so hard.
What Is the Discounted Cash Flow Formula?
The discounted cash flow formula is a method for valuing a business by projecting its future cash and converting that future money into today's dollars. In one sentence: it's how you turn "this company will make cash for the next ten years" into "this company is worth $X per share right now."
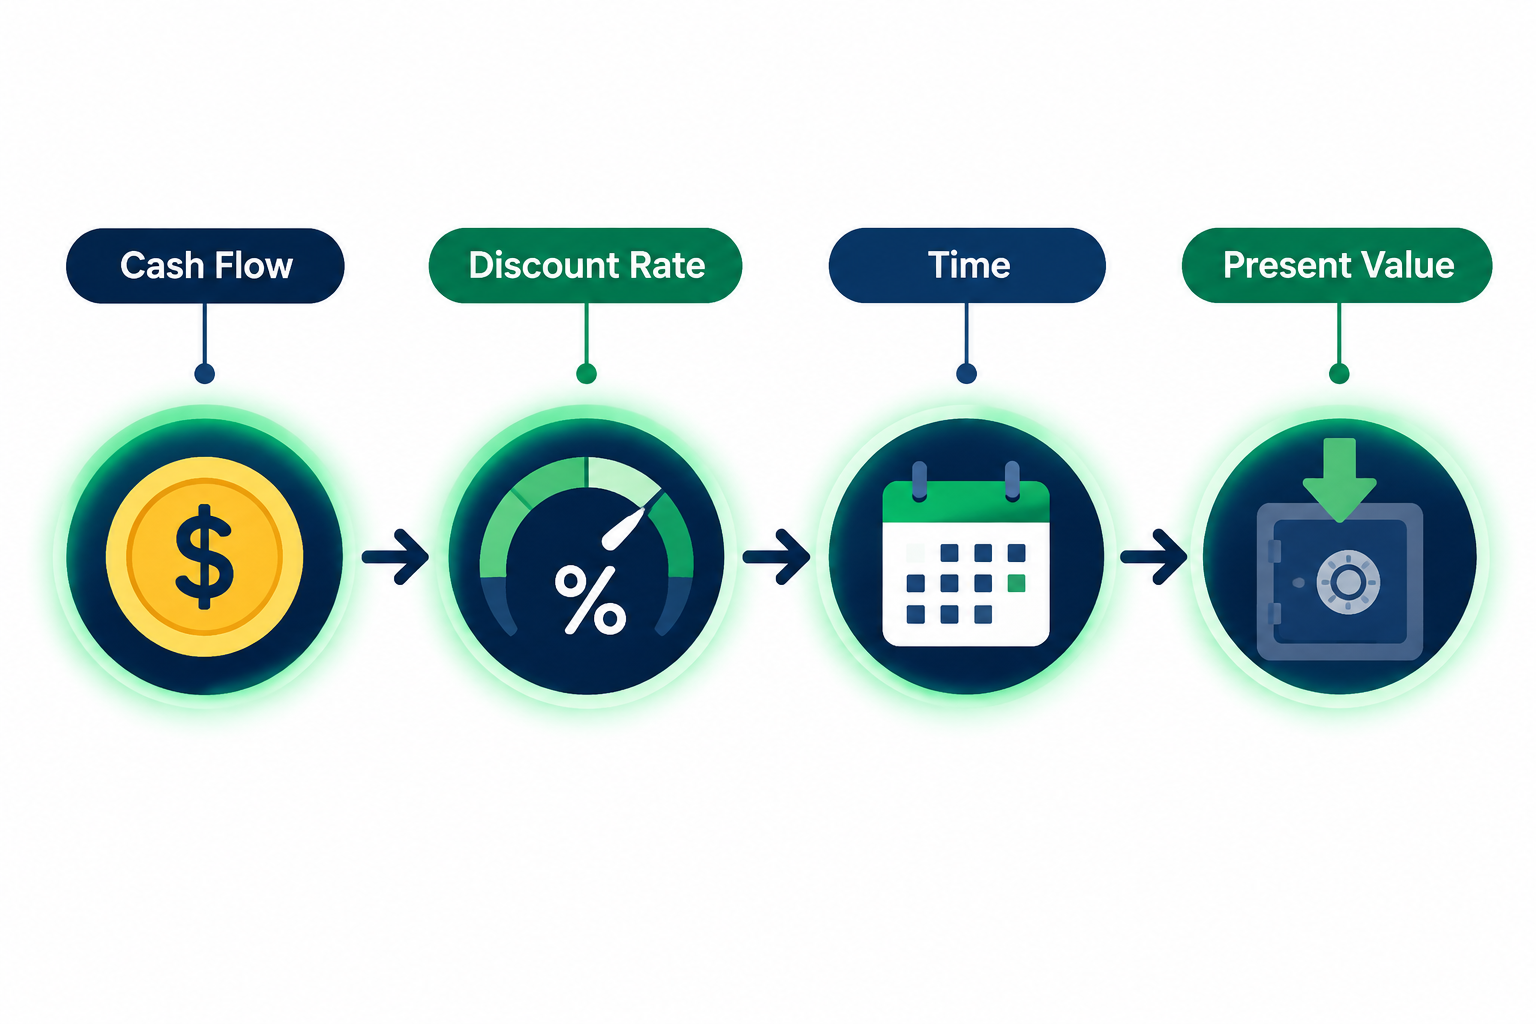
Here's the plain-text version of the discounted cash flow formula:
DCF Value = CF1 / (1+r)^1 + CF2 / (1+r)^2 + ... + CFn / (1+r)^n + Terminal Value / (1+r)^n
Break that down term by term, because each piece answers a specific question:
- CF (cash flow): How much cash does the business actually generate each year, after it pays for the stuff that keeps the lights on (this is the free cash flow figure).
- r (discount rate): How much return would you demand to tie up money in this business instead of something safer, like a treasury bond.
- n (the year number): How far into the future that cash flow arrives. Year 1, year 2, year 3, and so on.
- Terminal Value: A stand-in for every dollar of cash flow beyond the forecast window, because businesses (hopefully) don't stop existing after year five or ten.
Harvard Business School's updated valuation explainer frames DCF as an intrinsic-value method, meaning it tries to answer what a business is actually worth based on its own cash-generating ability, not what the market happens to be paying for it this week. Professor Suraj Srinivasan uses it in Harvard's capital budgeting curriculum precisely because it forces a decision-maker to separate "what will this actually produce" from "what is everyone else paying for something similar."
The benefit to you, the reader: this formula is the difference between buying a stock because the chart looks good and buying it because the underlying business can pay you back. It's the mechanism that turns a "fair value" badge in your app into an actual number you can question, stress-test, and defend at a dinner party.
Practical takeaway: the next time an app tells you a stock is 30% undervalued, ask what discount rate and growth rate produced that number. If you can't find it, you're trusting a black box, not a discounted cash flow formula.
How Does the Discounted Cash Flow Formula Work, Step by Step?
The discounted cash flow formula works by projecting a company's free cash flow for five to ten years, discounting each year back to today, adding a terminal value for everything after, and summing it all into one present-day number. Do that correctly and you get an intrinsic value estimate you can compare against the stock price.
Here's the sequence, in order:
- Estimate free cash flow. Start with operating cash flow, subtract capital expenditures. This is the cash a business could hand to owners without hurting operations.
- Project growth for 5 to 10 years. Harvard's updated explainer reinforces the standard five-to-ten-year forecast window as the professional norm. Beyond that horizon, forecasts get too shaky to trust.
- Pick a discount rate. Usually the Weighted Average Cost of Capital (WACC) for whole-company valuation, or the cost of equity for a per-share equity valuation.
- Discount each year's cash flow back to today. Divide each projected year's free cash flow by (1 + discount rate) raised to that year's power.
- Calculate terminal value and discount it too. This covers every dollar of cash flow after your explicit forecast window ends.
- Add everything together. The sum is your DCF value, which is also your Net Present Value (NPV) of the projected cash flows. That's why the FAQ question "is DCF basically NPV" has a short answer: yes, with a specific application to a company's cash flows.
CFA Institute's 2026 refresher reading draws a line between two versions of this formula: FCFF (free cash flow to the firm, used to value the whole enterprise before subtracting debt) and FCFE (free cash flow to equity, used to value shares directly). CFA data shows FCFF gets used roughly twice as often as FCFE among practicing analysts, mostly because it's cleaner when a company's capital structure is changing.
Why this matters to you: every step is a place where a bad assumption sneaks in. Knowing the six steps means you can find the weak link in any "fair value" number instead of just accepting it. That's the whole point of learning the discounted cash flow formula instead of outsourcing the thinking to an app.
Market truth: a discounted cash flow formula isn't magic. It's addition, division, and a set of guesses about the future dressed up in decimal points. Respect the guesses more than the decimals.
What Discount Rate Should You Use for a DCF?
Use the Weighted Average Cost of Capital (WACC) when valuing a whole company, or the cost of equity when valuing shares directly, and expect that number to land somewhere between 8% and 12% for most established businesses. Investopedia's DCF explainer confirms WACC as the standard choice for enterprise-level discounted cash flow formula work.
What goes into WACC:
- Cost of equity, usually estimated with the Capital Asset Pricing Model (CAPM), which combines a risk-free rate, a stock's beta (volatility relative to the market), and the equity risk premium investors demand for holding stocks instead of bonds.
- Cost of debt, the interest rate a company actually pays on its borrowing, adjusted for the tax break debt provides.
- The weighting between debt and equity, based on how the company is actually funded.
Why does 8% to 12% show up so often? Because the risk-free rate anchors the bottom of that range, the equity risk premium adds a few points on top, and a company's own leverage and risk profile push it around from there. A stable, cash-generating large-cap tends to sit near the low end. A speculative, debt-heavy small-cap belongs near the top, or higher.
Here's the practical problem: the discount rate is the single most sensitive input in the entire discounted cash flow formula. Investopedia's pitfalls analysis walked through a real example: dropping the discount rate from 12% to 10%, a 200-basis-point move, took one company's estimated value from $12.73 to $16.21. That's a 27% jump from a change most people would call "close enough."
Practical takeaway: never trust a single discount rate. Run the calculation at 8%, 10%, and 12% and look at the range, not one clean number. If the stock price sits below your low-end estimate, that's a real signal. If it only clears your high-end estimate, you're betting on optimism, not math.
How Do You Calculate Terminal Value?
Terminal value estimates everything a business will produce after your explicit forecast window ends, and it's calculated using either the perpetuity growth method or the exit multiple method. In most discounted cash flow formula builds, terminal value makes up more than half the total valuation, sometimes 70% or more.

Two ways to calculate it:
- Perpetuity growth method. Take the final year's projected free cash flow, grow it one more year at a conservative long-term rate (often close to GDP growth, roughly 2% to 3%), then divide by (discount rate minus growth rate). This assumes the business keeps producing cash forever at a slowing, sustainable pace.
- Exit multiple method. Apply a market multiple, like EV/EBITDA, to the company's final projected year of earnings, based on what similar mature businesses trade for. This borrows from the market-multiples world instead of assuming perpetual growth.
Why terminal value dominates the result: the first five years of cash flow are a small slice of a company's total future. Everything after that gets bundled into one number, discounted back once, and added in. Nudge the long-term growth rate from 2% to 3% and the terminal value, and therefore the whole valuation, moves more than almost any other input in the model.
Practical takeaway: whenever someone shows you a DCF output, ask what terminal growth rate they used. If it's above long-run GDP growth (roughly 2% real growth by most macro estimates), they're quietly assuming this company outgrows the entire economy forever. That's a red flag, not a rounding error.
Discounted Cash Flow Formula Example: A Worked Walkthrough With Real Numbers
Here's a full discounted cash flow formula example using a made-up company, labeled clearly as hypothetical, so the math is visible from start to finish. Call it Brightline Apps, Inc., a fictional software company for this walkthrough only.
Step 1: Starting free cash flow.
Brightline generated $50 million in free cash flow last year.
Step 2: Growth assumptions for years 1 through 5.
Assume 12% annual growth, tapering slightly as the base grows:
| Year | Growth Rate | Free Cash Flow |
|---|---|---|
| 1 | 12% | $56.0M |
| 2 | 11% | $62.2M |
| 3 | 10% | $68.4M |
| 4 | 9% | $74.6M |
| 5 | 8% | $80.6M |
Step 3: Discount rate.
Assume a 10% WACC, a middle-of-the-range figure consistent with the 8% to 12% band Investopedia describes for established, moderate-risk businesses.
Step 4: Present value of each year's cash flow.
| Year | Free Cash Flow | Discount Factor (1.10^n) | Present Value |
|---|---|---|---|
| 1 | $56.0M | 1.10 | $50.9M |
| 2 | $62.2M | 1.21 | $51.4M |
| 3 | $68.4M | 1.331 | $51.4M |
| 4 | $74.6M | 1.4641 | $51.0M |
| 5 | $80.6M | 1.61051 | $50.0M |
Sum of discounted years 1 through 5: roughly $254.7M.
Step 5: Terminal value.
Using the perpetuity growth method with a 2.5% terminal growth rate: take year 5's free cash flow ($80.6M), grow it once more to $82.6M, then divide by (0.10 minus 0.025) = 0.075. That gives a terminal value of roughly $1,102M. Discount that back five years at 10% (divide by 1.61051): present value of terminal value is roughly $684M.
Step 6: Add it up.
$254.7M (forecast years) plus $684M (discounted terminal value) equals roughly $938.7M in total enterprise value.
Step 7: Convert to per-share intrinsic value.
If Brightline has 100 million shares outstanding and no net debt to subtract, that's roughly $9.39 per share in intrinsic value. If the stock trades at $7.50, the discounted cash flow formula says it's undervalued. If it trades at $12, the model says walk away, or at least double-check every assumption you fed it.
Notice something important: the terminal value ($684M discounted) is nearly three times the size of the entire five-year forecast ($254.7M discounted). That's not unusual. That's the norm, and it's exactly why terminal value assumptions deserve more scrutiny than most retail investors give them.
DCF vs P/E vs Dividend Discount Model vs EV/EBITDA: Which Valuation Method Wins?
None of them "win" outright. The discounted cash flow formula, the price-to-earnings ratio, the dividend discount model, and EV/EBITDA each answer a slightly different question, and professionals use several at once rather than picking a favorite.
| Method | What It Measures | Key Inputs | Best For | Main Weakness |
|---|---|---|---|---|
| DCF | Intrinsic value from future free cash flow | FCF projections, discount rate, terminal value | Companies with predictable cash generation | Extremely sensitive to discount rate and growth assumptions |
| P/E Ratio | Price relative to current earnings | Stock price, earnings per share | Quick comparison across similar companies | Ignores debt, cash flow timing, and growth quality |
| Dividend Discount Model (DDM) | Value based on future dividends only | Dividend payments, growth rate, cost of equity | Mature, dividend-paying companies | Useless for companies that don't pay dividends |
| EV/EBITDA | Enterprise value relative to cash earnings before interest, taxes, depreciation, amortization | Enterprise value, EBITDA | Comparing capital-intensive businesses across debt levels | Ignores capital expenditure needs, can flatter debt-heavy firms |
CFA Institute's analyst survey data shows 92.8% of professional analysts use market multiples, compared to 78.8% who use DCF. That gap doesn't mean multiples beat DCF. It means most analysts run both and triangulate, using multiples as a sanity check on a DCF, or vice versa.
The Harvard Business School explainer makes a clean distinction between DCF and the discounted dividend model: both apply the time-value-of-money principle, but DCF uses total free cash flow instead of only what gets paid out as dividends. That makes DCF far more flexible. A company that reinvests everything and pays no dividend (think most fast-growing tech names) can still get a DCF valuation. It cannot get a meaningful DDM valuation.
Practical takeaway: don't marry one method. Run a DCF for intrinsic value, check it against a peer group's P/E or EV/EBITDA, and reserve the DDM for slow-growing dividend payers where it actually applies.
| Discount Rate | Category | Example Impact |
|---|---|---|
| 10% | Lower-risk assumption | $16.21 est. value (Investopedia example) |
| 12% | Higher-risk assumption | $12.73 est. value, 27% lower |
| 8%–10% | Typical stable large-cap WACC | Lower discount, higher valuation |
| 10%–12% | Average-risk company WACC | Mid-range valuation output |
| 12%–15%+ | Small-cap, cyclical, or speculative | Meaningfully lower valuation |
Where Does the Discounted Cash Flow Formula Go Wrong?
The discounted cash flow formula goes wrong most often on cyclical stocks caught at the top of a cycle, on growth assumptions that quietly assume a company outgrows the entire economy, and on discount-rate choices that swing the output by double digits with a single-percentage-point change. Accuracy depends entirely on the quality of the guesses feeding the math.

Cyclicals at the peak. A miner, an airline, or a homebuilder posting record profit at the top of a boom looks "cheap" on a DCF, because the model naively extends peak earnings forward. One trader on Reddit's r/dividends nailed the failure mode directly: "the valuations often don't make much sense like cyclicals at the top of the cycle will be considered undervalued. If you followed them, you would lose all your money." That's not a criticism of math. That's a criticism of feeding peak-cycle numbers into a formula that assumes steady growth.
Growth assumptions that don't hold up. Investopedia's pitfalls piece argues multiples-based methods can sometimes beat DCF specifically because multiples rely on observable market prices, while DCF relies on a forecast nobody can actually verify until it's already happened.
Discount-rate sensitivity. Covered above, but worth repeating here because it's the most common failure: a 200-basis-point change moved one example's value by 27%. If your model output moves that much from a "small" adjustment, the model was never precise to begin with. It was a range pretending to be a point estimate.
Common mistakes to watch for:
- Using a single-year snapshot of free cash flow instead of a normalized multi-year average
- Assuming margin expansion continues indefinitely without a reason
- Ignoring share dilution from stock-based compensation, which quietly shrinks per-share value over time
- Using one discount rate instead of a range
- Treating the terminal value like a footnote when it's usually the majority of the total
What if your cash flow projections are wrong? They will be, at least partially. That's not a flaw unique to your model, it's the nature of forecasting anything five to ten years out. The fix isn't better predictions. It's building in a margin of safety and re-running the model with conservative, base, and optimistic scenarios instead of trusting one number.
Market truth: a discounted cash flow formula is only as honest as the person filling it out. Garbage assumptions in, a confident-looking number out. That confidence is the trap.
Can You Use DCF for Startups, or Only Established Companies?
You can technically run a discounted cash flow formula on a startup, but the output is far less reliable than it is for an established, cash-generating business, because startup cash flow forecasting has almost nothing solid to anchor to. The further a company is from stable, predictable cash flow, the shakier every input in the formula becomes.
Why startup cash flow forecasting is a different animal:
- No historical cash flow pattern. DCF leans on a track record to sanity-check the forecast. A two-year-old company has no track record worth trusting.
- Growth rates are guesses, not extrapolations. Assuming 40% annual growth for five straight years is common in startup models and almost never survives contact with reality.
- Discount rates run higher. Early-stage risk pushes the appropriate discount rate well above the 8% to 12% range used for mature companies, sometimes into the high teens or twenties, which compresses present value hard.
- Terminal value becomes almost the entire story. If a startup isn't cash-flow positive yet, nearly all of its "value" sits in an assumption about a distant future state that may never arrive.
Practical takeaway: for startups, treat a DCF as a stress test of assumptions, not a valuation you'd bet real money on. Venture investors lean more on comparable transactions and revenue multiples for exactly this reason. Save the discounted cash flow formula for businesses with at least a few years of real, positive free cash flow behind them.
How Do You Estimate Future Cash Flows for a DCF, and How Far Out Should You Go?
Estimate future cash flow by starting with a company's recent free cash flow trend, applying a defensible growth rate tied to its actual industry and reinvestment needs, and projecting that forward for 5 to 10 years, which is the horizon Harvard Business School's updated explainer treats as the professional standard.
A workable process:
- Pull three to five years of historical free cash flow, not just one year, to smooth out one-time swings.
- Compare growth against the industry, not against the company's own best year ever.
- Build three scenarios: conservative, base case, optimistic. Never run the model on one guess.
- Stop the explicit forecast at year 5 or year 10 and hand everything after that to terminal value.
Why not project 20 or 30 years out? Because forecast error compounds. A small miss in year 2 barely matters. The same-sized miss in year 15 means you're discounting a number nobody could have predicted with any real confidence in the first place. Ten years is already a stretch for most businesses. Beyond that, terminal value assumptions do the heavy lifting, and they should.
Practical takeaway: if a DCF model you're looking at projects aggressive growth all the way to year 15, that's not diligence. That's a forecast dressed up to justify a price target. Cap your own confidence at year 5 to 10 and let terminal value carry the rest, honestly.
What Are the Benefits and Drawbacks of the Discounted Cash Flow Formula?
The discounted cash flow formula's biggest benefit is that it forces you to think like an owner, valuing a business on what it actually produces instead of what the crowd is paying for it. Its biggest drawback is that the output is only as good as assumptions nobody can fully verify until years later.

Benefits:
- Grounds a price in the actual cash a business generates, not market mood
- Works for companies that don't pay dividends, unlike DDM
- Forces explicit assumptions you can question, unlike a black-box "fair value" score
- Doubles as a sanity check against multiples-based valuation
Drawbacks:
- Extremely sensitive to discount rate, a small change swings the output hard
- Terminal value assumptions can dominate the entire result
- Garbage-in, garbage-out on growth forecasts, especially for cyclicals and startups
- Time-consuming compared to pulling up a P/E ratio
Practical takeaway: use DCF as one input in a decision, not the whole decision. Treat it like a compass, not a GPS. It points you in a direction. It doesn't guarantee the destination.
Is DCF Too Complicated for Beginner Investors?
No. The concept behind the discounted cash flow formula, that money today is worth more than the same money later, is something most people already understand intuitively. The intimidating part isn't the logic, it's the spreadsheet mechanics, and those can be outsourced.
Here's the honest framing:
- You don't need to build a discounted cash flow formula from scratch to benefit from understanding it.
- You do need to understand what the inputs mean, so you can question a number an app hands you.
- A beginner who understands "higher discount rate equals lower value" and "terminal value usually dominates the total" already knows more than most people clicking the "fair value" badge without a second thought.
Practical takeaway: start by reading the assumptions behind a stock's DCF-based fair value, not by building your own model on day one. Understanding beats calculating, at least until you're ready to build your own.
Which Tools Run the Discounted Cash Flow Formula for You?
Several platforms run the discounted cash flow formula behind the scenes and hand you a finished "fair value" number, including Simply Wall St, FAST Graphs, GuruFocus, and free spreadsheet templates you can build yourself in about an hour. Each takes a different approach to the same core math.
Simply Wall St. Publishes its DCF model logic on GitHub, which means its methodology is genuinely inspectable, not a black box. It's one of the few consumer tools that shows its work rather than just asserting a fair value figure.
FAST Graphs. Draws an orange "fair value" line based primarily on historical earnings multiples rather than a pure DCF, but it visualizes the same underlying idea: comparing a current price against an estimate of underlying value over time.
GuruFocus. Runs its own DCF calculator alongside other valuation models, letting you toggle discount rate and growth assumptions rather than accepting a single fixed output.
Free spreadsheet templates. A basic Excel or Google Sheets DCF model needs exactly five inputs: historical free cash flow, a growth rate assumption, a discount rate, a terminal growth rate, and shares outstanding. That's the entire discounted cash flow formula example built earlier in this piece, just in cell references instead of a table. Stock Analysis's newly launched DCF calculator, released September 18, 2026, added sensitivity tables specifically so users could see how the output shifts across a range of discount rates instead of trusting one number.
Where AI-scored tools fit in. Some newer platforms blend DCF-style intrinsic value work with broader scoring systems. Kavout's Kai Score is one example of an institutional-style score attempting to condense multiple valuation signals, DCF included, into one composite number for retail investors. Screening tools built for ETFs, like the ones covered in AI ETF screeners compared for US investors, sometimes layer fair-value logic on top of fund-level data too. And plenty of everyday brokers, including SoFi Invest, now surface basic valuation context right inside the trading app.
What these tools are not. Options flow platforms like Cheddar Flow, Flow Greeks, RockFlow, and Bullflow show what other traders are doing right now, reading the tape, tracking unusual options activity, watching price action. That's a completely different question than "what is this business worth over the next decade." Don't confuse a live order-flow scanner with a discounted cash flow formula. One tells you what's happening. The other tells you what should happen, eventually, if the assumptions hold.
Practical takeaway: if an app's fair value number is opaque, look for one that publishes its method, like Simply Wall St's public GitHub model. Transparency about assumptions matters more than the precision of the final digit.
How Should You Use a DCF in a Real Buying Decision?
Use a discounted cash flow formula output as a range, not a single price target, and only act when the current stock price sits meaningfully below your conservative estimate. That gap is your margin of safety, and it's what protects you from your own bad assumptions.
A workable process:
- Run the model three times: conservative, base, and optimistic growth and discount rate assumptions.
- Look at where the current price falls relative to that range. Below the conservative estimate is a real signal. Only clearing the optimistic estimate is a warning, not an opportunity.
- Cross-check against a peer group's P/E or EV/EBITDA. If your DCF says "cheap" but every comparable multiple says "expensive," something in your model is off.
- Sanity-check the terminal growth rate against real-world GDP growth. If it's assuming perpetual outperformance, discount your own confidence accordingly.
- Revisit the model whenever new earnings data lands. A DCF built on stale numbers is a DCF built on nothing.
Market truth: the discounted cash flow formula rewards patience and punishes shortcuts. It's built for process over prediction, not for chasing a breakout or timing a bottom. If you want a tool for reading the tape, this isn't it. If you want a framework for deciding what a business is actually worth before you buy, it's one of the best ones available.
Practical takeaway: treat the fair value badge in your favorite app as a starting question, not a final answer. Pull up the assumptions, run your own range, and only pull the trigger when the math and the price disagree in your favor.
The Numbers Behind the Discounted Cash Flow Formula
Here are the concrete figures that back up everything above, each tied to a named source.
- 78.8% of professional analysts use DCF models, and 86.9% of those specifically use discounted free cash flow, per CFA Institute's 2026 refresher reading.
- 92.8% of analysts use market multiples, more common than DCF but usually used alongside it, according to the same CFA Institute data.
- FCFF gets used roughly twice as often as FCFE among practicing analysts, per CFA Institute.
- A 200-basis-point discount rate change (12% to 10%) produced a 27% valuation swing, from $12.73 to $16.21, according to Investopedia's pitfalls analysis.
- The standard DCF forecast window sits at 5 to 10 years, confirmed by Harvard Business School's 2026 updated explainer.
- Typical discount rates in DCF work cluster between 8% and 12%, tied to WACC, per Investopedia's core DCF definition.
- Indian valuation compliance rules reference a 10% safe-harbor tolerance band around DCF-based pricing, according to capmint's DCF glossary explainer, which shows the formula's reach beyond pure investing into regulatory valuation work.
Frequently Asked Questions
How to calculate discounted cash flow formula?
Project a company's free cash flow for 5 to 10 years, discount each year back to today using a discount rate (usually WACC), calculate a terminal value for everything beyond that window, discount the terminal value too, then add every discounted figure together. That total is your DCF value, per Investopedia.
Does Warren Buffett use discounted cash flow?
Buffett has said publicly he doesn't build detailed spreadsheet DCF models, but he uses the same underlying logic: he estimates a business's future owner earnings and mentally discounts them, favoring businesses with predictable cash generation over precise formula outputs. The concept matters more to him than the calculator.
What are the 5 steps of a DCF?
Estimate free cash flow, project growth for 5 to 10 years, choose a discount rate (typically WACC), discount each projected year back to present value, then calculate and discount a terminal value for everything beyond the forecast window. Add all the discounted figures together for the final valuation, as outlined by Harvard Business School.
Is DCF basically NPV?
Yes, with a specific application. Net Present Value (NPV) is the general math concept of discounting future cash flows to today's dollars. A DCF valuation applies that exact concept to a company's projected free cash flow to estimate intrinsic value, so a DCF output is a company-specific NPV calculation.
What discount rate should I use for a DCF?
Use WACC (Weighted Average Cost of Capital) for whole-company valuations, typically landing between 8% and 12% depending on risk, per Investopedia. Higher-risk, smaller, or cyclical companies deserve higher discount rates. Run multiple rates, not one, since small changes swing the output significantly.
What is terminal value in a DCF?
Terminal value estimates all cash flow beyond your explicit forecast window, usually years 6 through infinity. It's calculated with either the perpetuity growth method or an exit multiple, and it typically makes up the majority of a DCF's total output, sometimes 70% or more of the final value.
Is DCF accurate?
DCF is only as accurate as its inputs, and it's highly sensitive to discount rate and growth assumptions. Investopedia's analysis shows a 200-basis-point rate change causing a 27% valuation swing, which means DCF works best as a range, not a precise point estimate.
What is free cash flow?
Free cash flow is the cash a business generates from operations after subtracting capital expenditures needed to maintain or grow the business. It's the actual money available to pay down debt, return to shareholders, or reinvest, and it's the core input every discounted cash flow formula depends on.
Can I do a DCF in Excel?
Yes. A basic DCF model in Excel needs five inputs: historical free cash flow, a growth rate assumption, a discount rate, a terminal growth rate, and shares outstanding. Free templates covering this exact structure are widely available, and the newly launched Stock Analysis DCF calculator adds built-in sensitivity tables for the same math.
Which apps calculate DCF for me?
Simply Wall St publishes its DCF model on GitHub for transparency, GuruFocus runs an adjustable DCF calculator, and FAST Graphs visualizes a related fair-value concept using historical earnings multiples. Several AI-scoring platforms, like Kavout's Kai Score, also blend DCF-style logic into a composite score.
Conclusion: Should You Trust a Discounted Cash Flow Formula?
Trust the logic. Question every input. That's the whole relationship you should have with a discounted cash flow formula, whether you're building one in a spreadsheet or reading one off a Simply Wall St fair value badge.
The math itself isn't the risk. Free cash flow, a discount rate, a growth assumption, a terminal value, added up and shrunk back to today's dollars. Anyone can follow that. The risk is trusting a confident-looking number without checking what fed it, especially on a cyclical stock at the top of its cycle, or a growth forecast that quietly assumes a company outruns the entire economy forever.
Do this next: pick one stock you already own or want to own. Find its DCF-based fair value in whatever app you use. Then find the discount rate and growth assumptions behind that number. If you can't find them, that's your answer about how much to trust the badge.
Systems over hacks. A discounted cash flow formula you understand beats a fair value score you just believe.
FullStack Alpha cuts the noise so you can keep the alpha. Browse the AI tools and valuation systems tested at aistockpickerapps.com.
Depth here, breadth there. One formula covered in full. 200+ AI stock tools catalogued by category and price in the FullStack Alpha directory. Browse the directory → aistockpickerapps.com
This article is for educational purposes only and is not investment advice. Some links on this page may be affiliate links.