AI Portfolio Analysis: What It Catches That You Miss
Last updated: June 30, 2026
Quick Answer: AI portfolio analysis uses machine learning and large datasets to scan your holdings for risks, correlations, and inefficiencies that human review routinely overlooks — things like hidden sector concentration, tax loss harvesting windows, and cross-asset correlations that only show up under stress. It doesn't replace your judgment, but it does the grunt work faster and more completely than any spreadsheet you've built at midnight.
Key Takeaways
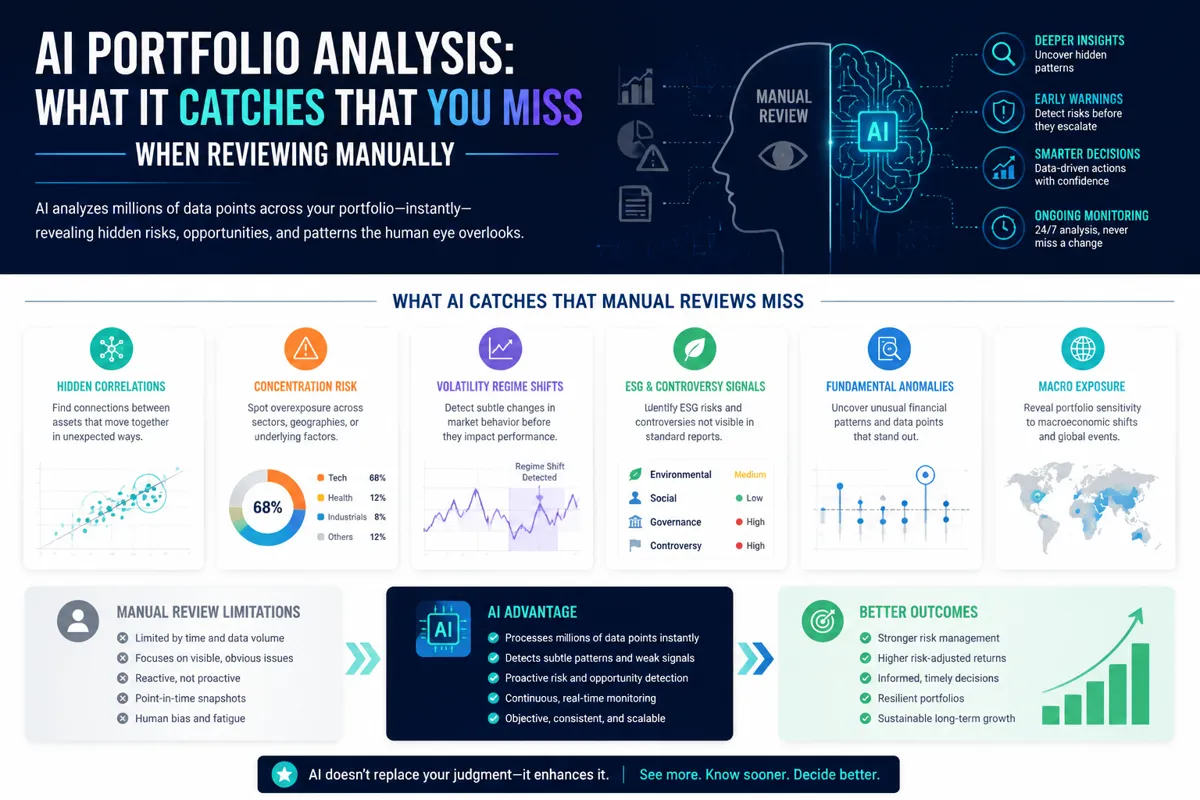
- AI portfolio analysis processes thousands of data points simultaneously, catching concentration risk, hidden correlations, and tax inefficiencies that manual review misses.
- Tools like Danelfin, Stock Rover, Kavout, Magnifi, and Prospero.ai each approach portfolio analysis from a different angle — scoring, fundamentals, ranking, gap detection, and daily signals.
- Automated portfolio analysis doesn't predict the future. It maps the risk landscape so you can make better decisions.
- AI portfolio risk assessment is most valuable when markets get choppy — that's exactly when human bias spikes and blind spots get expensive.
- Cost ranges from free tiers to $50–$200/month for professional-grade tools. Most retail investors are underserved by the free options.
- AI works best as a second opinion, not a replacement for your own process. Systems over hacks.
- Crypto portfolios can be analyzed by AI tools, but volatility and correlation instability make outputs less reliable than for equity portfolios.
- Beginners benefit most from the educational layer; experienced investors benefit most from the correlation and tax optimization features.
What Is AI Portfolio Analysis and How Does It Work?
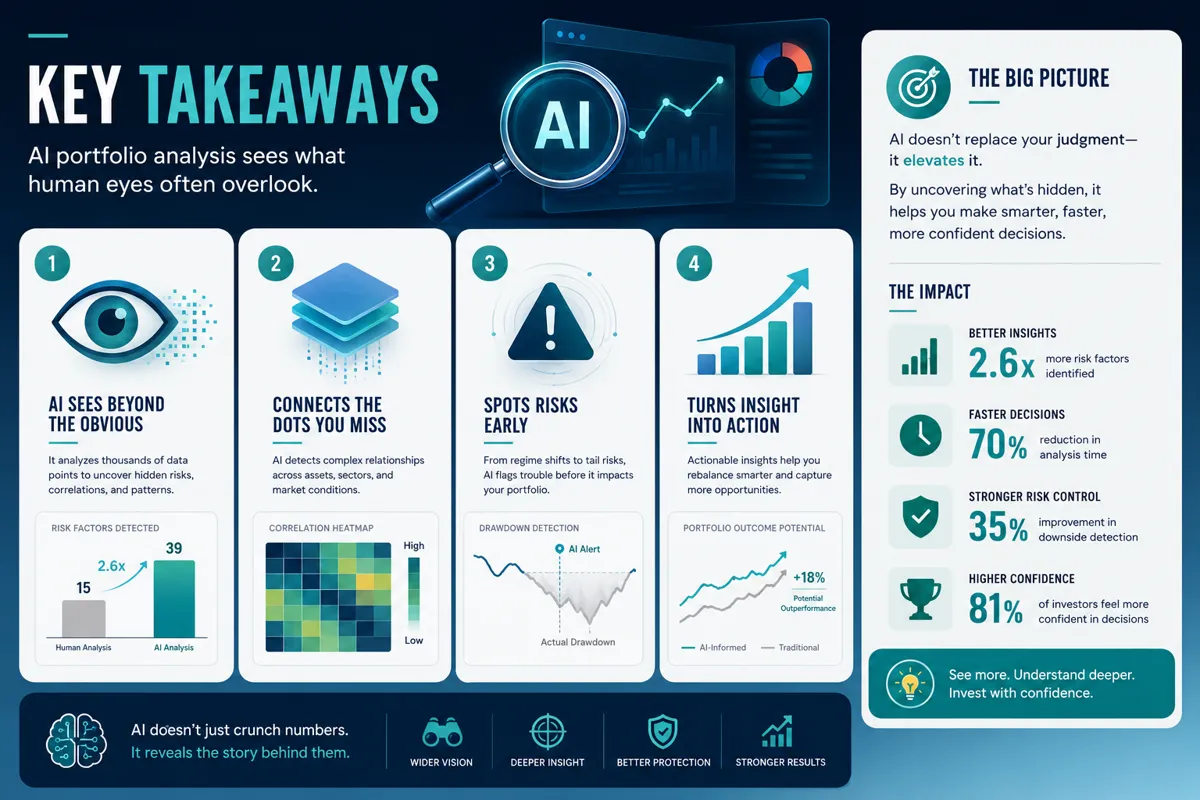
AI portfolio analysis is the process of using machine learning algorithms and large-scale data processing to evaluate a portfolio's composition, risk profile, and performance — automatically, and at a depth that manual review can't match. Instead of you eyeballing a spreadsheet, the AI ingests your holdings, runs them against historical data, macro factors, and real-time signals, then surfaces what actually matters.
Here's the basic mechanics:
- Data ingestion: The tool pulls your holdings (manually entered or via broker sync) and maps each position against thousands of variables — sector, geography, factor exposure, earnings history, volatility profile.
- Correlation mapping: It calculates how your positions move relative to each other, not just individually. Two stocks that look different on paper can be nearly identical in a downturn.
- Risk scoring: Tools like Danelfin run over 10,000 data points per stock daily to generate AI scores. Kavout's Kai Score ranks stocks on quantitative risk-adjusted metrics. These scores feed into a portfolio-level risk picture.
- Gap detection: Magnifi, an AI investment assistant, flags where your portfolio is underweight or overexposed relative to your stated goals.
- Signal generation: Prospero.ai delivers daily AI-curated signals, including a free tier, so you're not flying blind between rebalancing events.
What does AI portfolio analysis show? It shows you the stuff that feels fine until it isn't: overlapping sector bets, volatility drag, tax inefficiencies, and positions that correlate when the market sells off hard.
AI Portfolio Analysis: What It Catches That You Miss When Reviewing Manually
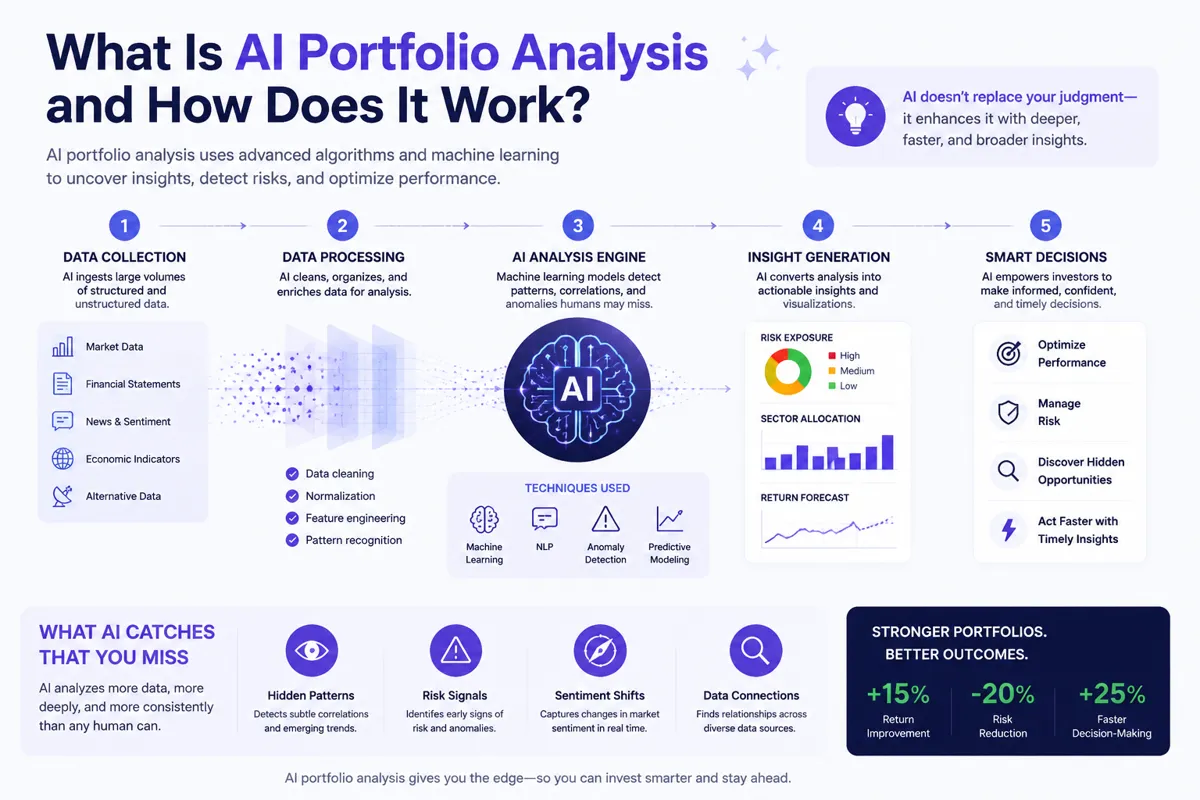
Most investors think they're diversified. They're usually not. This is the core problem that AI portfolio analysis solves.
The human brain is terrible at tracking correlations across more than four or five variables at once. You might own a tech ETF, a few individual tech names, and a "diversified" growth fund — and not realize that 60% of your portfolio moves with the Nasdaq. That wasn't in our bingo card when you built the watchlist, but it's exactly what the AI catches.
Common mistakes that manual portfolio review misses:
- Sector concentration disguised by ticker diversity. Owning MSFT, NVDA, AAPL, and QQQ feels like four positions. It's basically one bet.
- Factor crowding. If all your picks score high on momentum, you're running a momentum portfolio whether you meant to or not. When momentum unwinds, everything unwinds together.
- Volatility drag. High-volatility positions cost you more in bad periods than the upside recovers in good ones. Most investors never quantify this.
- Tax inefficiency. Holding losers past year-end when harvesting them would offset gains elsewhere. Automated portfolio analysis flags these windows.
- Benchmark drift. Your "balanced" portfolio from two years ago may be 80% equities today after a bull run. AI portfolio trackers catch this without you having to recalculate manually.
The practical takeaway: run an AI portfolio analysis at least quarterly, and always before earnings season. The choppy tape is not the time to discover you're overexposed.
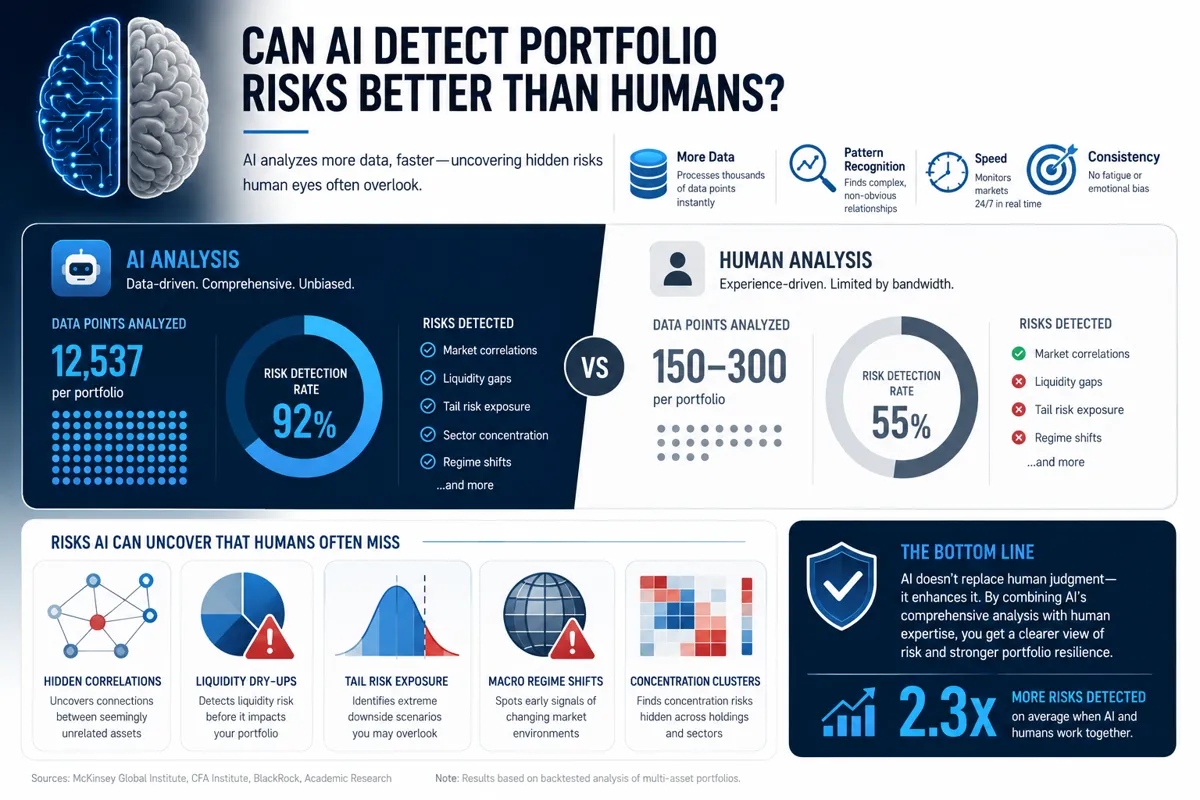
Can AI Detect Portfolio Risks Better Than Humans?
For systematic, data-driven risk detection, yes — AI outperforms human review in speed, scope, and consistency. For judgment calls about macro context or your personal situation, humans still matter.
An AI portfolio risk assessment doesn't get tired, doesn't get emotional after a bad week, and doesn't skip the correlation check because it's late. It runs the same process every time. That consistency is the edge.
Where AI wins on risk detection:
- Stress testing across hundreds of historical scenarios simultaneously
- Identifying tail risk — the low-probability, high-damage outcomes most investors ignore
- Flagging liquidity risk in smaller positions that could be hard to exit in a volatile market
- Catching beta creep, where a portfolio's market sensitivity drifts higher without the investor noticing
Where human judgment still matters:
- Interpreting why a correlation exists and whether it's structural or temporary
- Applying life context (time horizon, tax bracket, income stability) that no tool fully captures
- Deciding whether a flagged risk is worth taking based on your actual conviction
The honest answer: use AI portfolio analysis as your first filter and your own judgment as the final call. Discipline beats prediction, but data beats guessing.
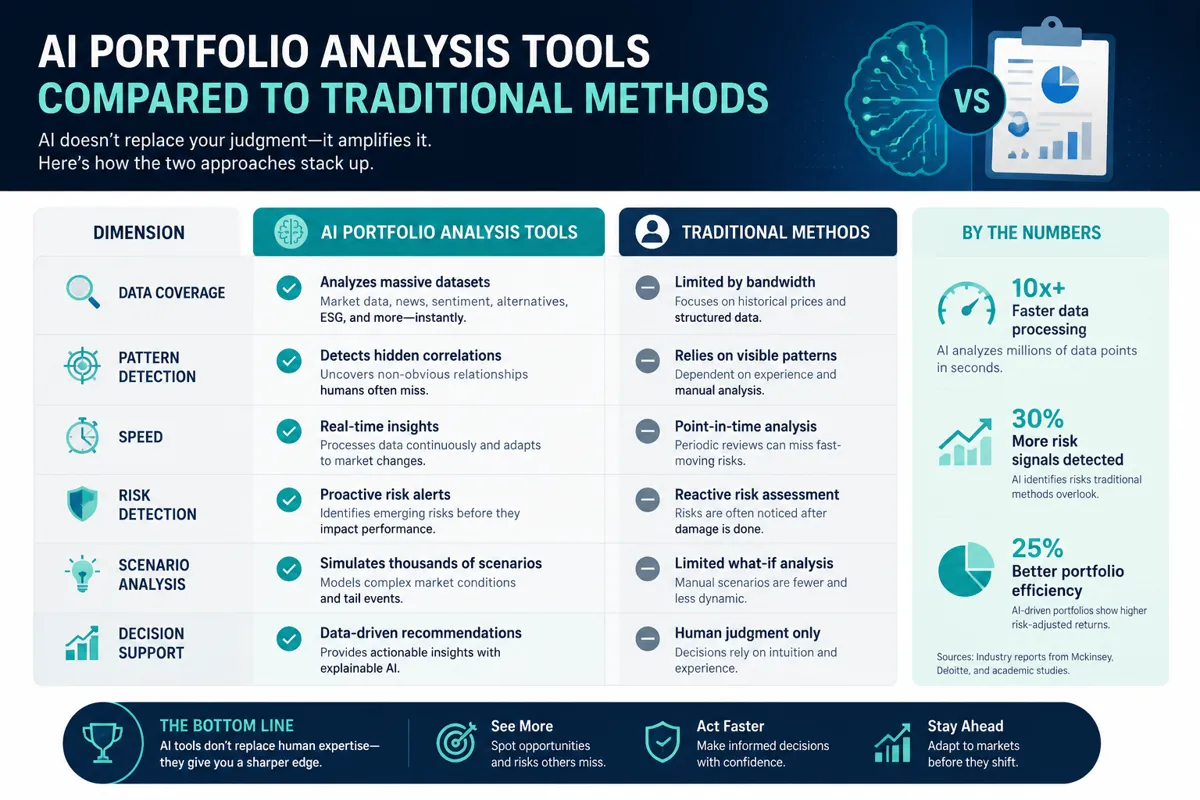
AI Portfolio Analysis Tools Compared to Traditional Methods
Traditional portfolio analysis means spreadsheets, Morningstar style boxes, and a quarterly review where you check if you're still roughly 60/40. It's better than nothing. It's also about as useful as checking your blood pressure once a year and calling it a health plan.
Here's the honest comparison:
| Feature | Traditional Analysis | AI Portfolio Analysis |
|---|---|---|
| Correlation detection | Basic (2-asset) | Multi-asset, dynamic |
| Tax loss harvesting | Manual, often missed | Automated flagging |
| Risk scoring | Broad categories | Quantitative, daily |
| Rebalancing alerts | Scheduled, manual | Triggered by drift thresholds |
| Behavioral bias check | None | Some tools flag overconcentration |
| Data volume processed | Dozens of variables | Thousands per position |
| Speed | Hours to days | Real-time to daily |
Tools worth knowing in 2026:
- Danelfin — AI portfolio scoring with 10,000+ data points per stock daily. Strong for individual stock-level risk within a portfolio.
- Stock Rover — Deep portfolio X-ray with a fundamental data analysis layer. Good for long-term investors who want to understand what they own.
- Magnifi — AI investment assistant that detects portfolio gaps and suggests targeted additions.
- Kavout — Kai Score system for quantitative risk assessment and portfolio ranking.
- Prospero.ai — Daily AI-curated portfolio signals with a free tier. Good entry point for investors testing automated portfolio analysis.
For a broader comparison of 100+ AI stock tools, the AI research tools directory covers what each platform actually does versus what it claims.
How Much Does AI Portfolio Analysis Software Cost?
AI portfolio analysis tools range from free to roughly $200/month, depending on depth of features and data access.
Free tiers: Prospero.ai, basic Magnifi, and several free AI tools offer entry-level portfolio scanning. Good for beginners building a habit. Limited on depth.
Mid-range ($20–$80/month): Stock Rover's premium tiers, Kavout's standard plans. This is where you get real correlation analysis, rebalancing alerts, and tax loss harvesting flags. Most active retail investors land here.
Professional ($100–$200/month): Institutional-grade tools with deeper factor analysis, stress testing, and API access. Relevant for traders managing larger accounts or running systematic strategies.
The honest math: If AI portfolio analysis saves you one bad position per year — say, catching a 15% concentrated loss before it becomes a 40% one — the tool pays for itself many times over. The question isn't whether you can afford it. It's whether you can afford not having it.
How Does AI Find Hidden Correlations in a Portfolio?
AI finds hidden correlations by calculating how assets move together across multiple time frames, market regimes, and stress scenarios — not just under normal conditions. This is the part that catches most investors off guard.
Standard correlation math (Pearson correlation) tells you how two assets moved together historically. That's useful. What it misses is that correlations change under stress. Assets that look uncorrelated in a calm market can move in lockstep during a selloff.
AI portfolio analysis tools handle this by:
- Running rolling correlations across different time windows (30-day, 90-day, 1-year)
- Testing correlations during specific historical stress events (2020 COVID crash, 2022 rate spike)
- Identifying factor-level correlations — two stocks in different sectors that both load heavily on the "high beta growth" factor
- Flagging when correlation between two positions has recently increased, which often signals a regime change
Practical takeaway: If your portfolio has more than 10 positions, you cannot track all pairwise correlations manually. An AI stock portfolio analyzer does this in seconds. Use it before adding a new position, not after.
Can AI Portfolio Analysis Help With Tax Loss Harvesting?
Yes, and this is one of the clearest, most concrete ways AI portfolio analysis pays for itself. Tax loss harvesting means selling a losing position to realize the loss for tax purposes, then replacing it with a similar (but not identical) position to maintain market exposure.
The IRS wash-sale rule (which prohibits buying the same or "substantially identical" security within 30 days before or after the sale) makes this tricky to manage manually across a large portfolio. AI tools automate the identification and flag compliant replacement options.
What the AI catches that you miss:
- Positions sitting at a loss that you've mentally written off as "long-term holds" but could be harvested now
- Optimal timing windows before year-end
- Wash-sale conflicts you'd trigger if you executed without checking
- Cumulative tax drag across the portfolio, not just individual positions
For investors using robo-advisor platforms or tools like Magnifi and Stock Rover, tax loss harvesting alerts are often built into the dashboard. It's one of those features that sounds boring until you realize it's worth real dollars.
Who Should Use AI Portfolio Analysis and Who Shouldn't
AI portfolio analysis is most valuable for investors with more than five holdings, a time horizon longer than six months, and enough capital that a 20% drawdown actually hurts. That covers most retail investors ages 25–55.
Use it if:
- You hold 10+ positions and can't track correlations manually
- You've ever been surprised by how much your "diversified" portfolio dropped in a correction
- You're in a taxable account and not actively harvesting losses
- You're rebalancing less than twice a year
Skip it (or use free tiers only) if:
- You hold three or fewer ETFs in a tax-advantaged account and rebalance annually — a simple investing strategy may be all you need
- You're day trading individual stocks with tight stop losses — the relevant analysis is price action and risk-reward, not portfolio-level correlation
- You're paper trading and still building a process — paper trade it first, then add analytical tools
The honest caveat: no AI portfolio analysis tool is a substitute for understanding what you own. Analysis paralysis is real. Get the data, act on it, move on.
AI Portfolio Analysis for Beginners vs. Experienced Investors
The tool is the same. What you get out of it depends on where you are in your process.
For beginners: The biggest value is the educational layer. Seeing that your portfolio is 70% correlated to one sector, or that you're holding five positions that all spike on the same macro catalyst, teaches you something no YouTube video will. Use the swing trading and investing education alongside the tool.
For experienced investors: The value shifts to optimization. You already know what diversification means. The AI is catching the subtle stuff — factor crowding, tax drag, volatility-adjusted return comparisons, and the correlation shifts that only show up in stress scenarios. Tools like Kavout's Kai Score and Stock Rover's fundamental data layer are built for this level.
The common mistake at both levels: treating the AI output as a buy or sell signal rather than a risk map. What does AI portfolio analysis show? It shows you where the risk is. What you do about it is still your call.
Does AI Portfolio Analysis Work for Cryptocurrency Portfolios?
AI portfolio analysis can be applied to crypto portfolios, but with meaningful limitations. Crypto assets have shorter price histories, higher volatility, and correlation structures that shift dramatically and unpredictably — which makes the outputs less reliable than for equity portfolios.
What AI tools can still do for crypto:
- Flag concentration risk (holding 80% in BTC and ETH is still concentration)
- Identify when crypto holdings are increasing overall portfolio volatility beyond your stated risk tolerance
- Track correlation between crypto and equity holdings, which spiked significantly during the 2022 risk-off period
What they struggle with:
- Stress testing against scenarios with no historical precedent
- Predicting correlation behavior during crypto-specific events (exchange failures, regulatory shocks)
- Providing reliable tax loss harvesting guidance across multiple wallets and chains
Play stupid games, win stupid prizes — running a crypto portfolio without any systematic risk assessment is the equivalent of driving without a speedometer. Use the tools, weight the outputs appropriately, and keep position sizing tight.
What Happens If You Don't Use AI for Portfolio Analysis?
You manage risk manually, which means you manage it inconsistently. Some months you review everything, some months you don't. You catch the obvious problems and miss the subtle ones. That's the real cost.
The specific risks of skipping automated portfolio analysis:
- Concentration risk compounds silently. A position that starts at 5% of your portfolio and doubles is now 10%. You didn't decide to have a 10% position — it just happened.
- Tax inefficiency accumulates. Every year you don't harvest losses is a year you paid taxes you didn't have to.
- Correlation risk blindsides you in the next correction. The market doesn't care that you thought you were diversified.
- FOFO — Fear of Finding Out — keeps you from looking. If you haven't checked your actual risk exposure recently, that's not a strategy. That's avoidance.
The fix isn't complicated. Run an AI portfolio analysis today. Set a calendar reminder to run it again in 90 days. That's the system. Consistency over hype.
Frequently Asked Questions
What is the difference between portfolio analysis and portfolio management?
Portfolio analysis is the diagnostic step — assessing what you own, the risks, and the gaps. Portfolio management is the ongoing process of making decisions based on that analysis. AI portfolio analysis automates the diagnostic layer; the management decisions still require human judgment.
What does an AI portfolio analysis tool actually show you?
It shows correlation between holdings, sector and factor concentration, risk-adjusted return metrics, tax loss harvesting opportunities, volatility contribution by position, and how the portfolio would have performed in historical stress scenarios.
Is AI portfolio analysis accurate for predicting returns?
No tool accurately predicts returns, and any that claims to should be treated with skepticism. AI portfolio analysis is accurate for mapping current risk exposure and identifying structural inefficiencies. It's a risk tool, not a crystal ball.
What is the best AI portfolio analyzer for retail investors in 2026?
It depends on your need. Stock Rover is strong for fundamental-focused investors. Kavout and Danelfin are strong for quantitative scoring. Magnifi works well for gap detection. Prospero.ai is the best free entry point. Compare them directly using the AI stock tools directory.
How often should I run an AI portfolio analysis?
At minimum, quarterly. Ideally, monthly — and always before adding a significant new position or heading into earnings season.
Can AI portfolio analysis help with rebalancing?
Yes. AI portfolio rebalancing tools flag when your allocation has drifted beyond target thresholds and suggest trades to bring it back in line, often accounting for tax consequences in the process.
Is there a free AI portfolio analyzer worth using?
Prospero.ai's free tier and basic Magnifi access are legitimate starting points. For deeper analysis, the free tiers run out of depth quickly. Check the free tools section for current options.
Does AI portfolio analysis work for small accounts under $10,000?
Yes, though the tax loss harvesting features are less impactful at small account sizes. The correlation and concentration analysis is equally valuable regardless of account size.
What's the difference between an AI portfolio tracker and an AI portfolio analyzer?
A tracker monitors performance and allocation over time. An analyzer goes deeper — running risk assessments, correlation mapping, and stress tests. Most good tools do both, but the analyzer function is where the real value is.
Can I use AI portfolio analysis alongside a robo-advisor?
Yes. Robo-advisors handle execution and basic rebalancing. An AI portfolio analyzer adds a diagnostic layer that most robo-advisors don't provide — particularly around tax optimization and correlation analysis across accounts.
Conclusion: Cut the Noise, Keep the Alpha
Here's the bottom line on AI portfolio analysis: it catches the slow leaks. Not the dramatic blowups — those you usually see coming. The slow leaks are the concentration that built up over 18 months, the tax drag you never quantified, the correlation that only shows up when everything sells off at once.
The tools exist. They're accessible. Most of them are affordable. The only reason not to use them is the same reason most investors don't review their portfolios regularly: it's uncomfortable to find out what's actually there.
That's not a technology problem. That's a discipline problem. And discipline beats prediction every time.
Three things to do this week:
- Run a full AI portfolio analysis on your current holdings using at least one of the tools mentioned above. Stock Rover for fundamentals, Kavout for quantitative scoring, Magnifi for gap detection.
- Look specifically at your correlation matrix. If more than 60% of your positions move together, you're not as diversified as you think.
- Check for tax loss harvesting opportunities before the next quarter closes.
Signal over noise. Process over prediction. That's the system.
We test the AI stock tools so you don't waste months on the wrong ones. Browse the full breakdowns at aistockpickerapp.com.