The AI Stock Research Tool That Reads Every 10-K So You Don't Have To
Last updated: June 16, 2026
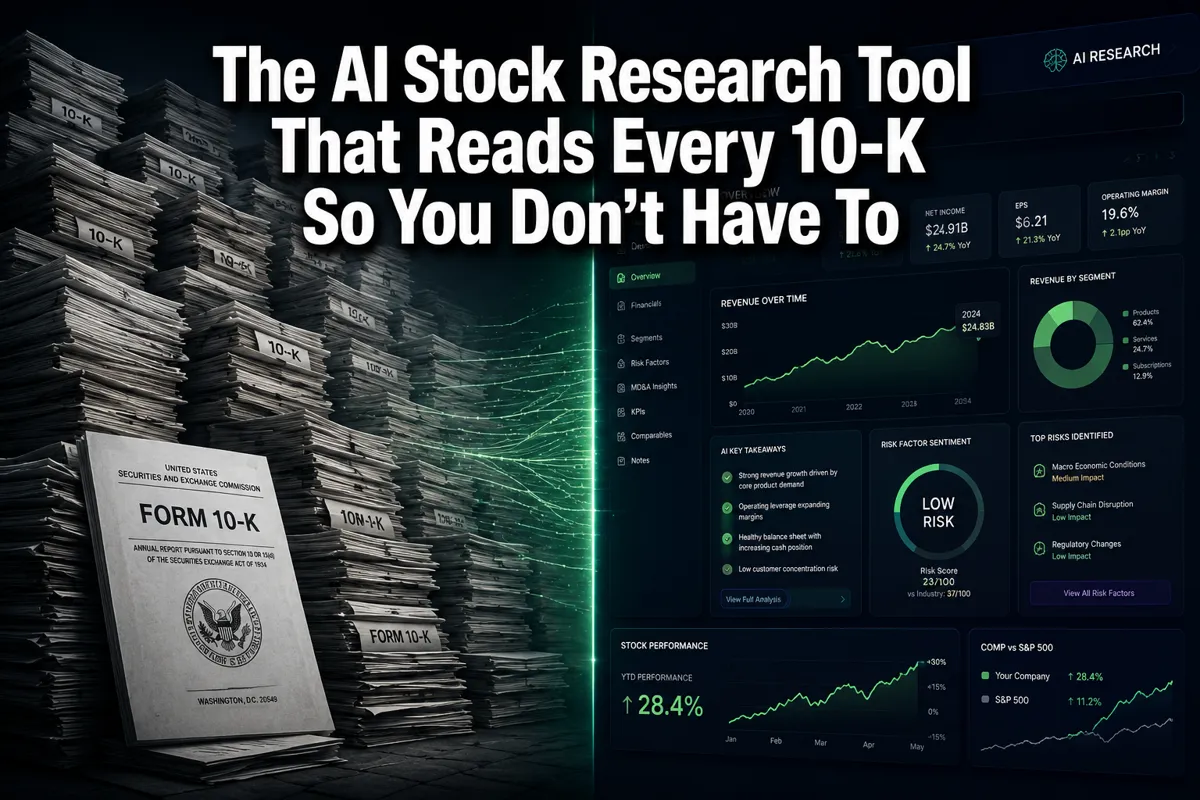
Quick Answer: An AI stock research tool that reads 10-K filings uses natural language processing to parse SEC annual reports in minutes, extracting key financial metrics, risk factors, and red flags that would take a human analyst hours to find. These tools range from free to roughly $50–$200/month for retail investors. They don't replace judgment, but they do eliminate the grunt work — so you can spend your time on the decision, not the document.
Key Takeaways
- A 10-K is a company's annual report filed with the SEC — often 200+ pages of dense financial and legal language. AI tools compress that into a readable brief in under five minutes.
- The best AI stock research tools pull directly from SEC EDGAR filings, so the data is sourced, not estimated.
- These tools are best suited for fundamental investors, swing traders doing earnings research, and beginners building a research process.
- Day traders focused purely on price action and tape reading will get less value from 10-K analysis tools than from real-time scanners.
- AI tools can flag accounting red flags — revenue recognition changes, auditor switches, goodwill spikes — that most retail investors skip right past.
- Cost ranges from free tiers (limited coverage) to $200/month for institutional-grade platforms. Most retail investors land in the $20–$50/month range.
- AI accuracy is high for data extraction. It's lower for qualitative judgment calls — that part still needs a human brain in the loop.
- Coverage is primarily US-listed companies, but platforms like StoxHub and Beefi.ai are extending into ASX, NZX, and multilingual markets.
What Exactly Is an AI Stock Research Tool That Reads 10-K Reports?
An AI stock research tool that reads 10-K filings is software that ingests SEC annual reports and translates them into plain-English summaries, financial scorecards, and risk flags — automatically, without a human analyst doing the heavy lifting.
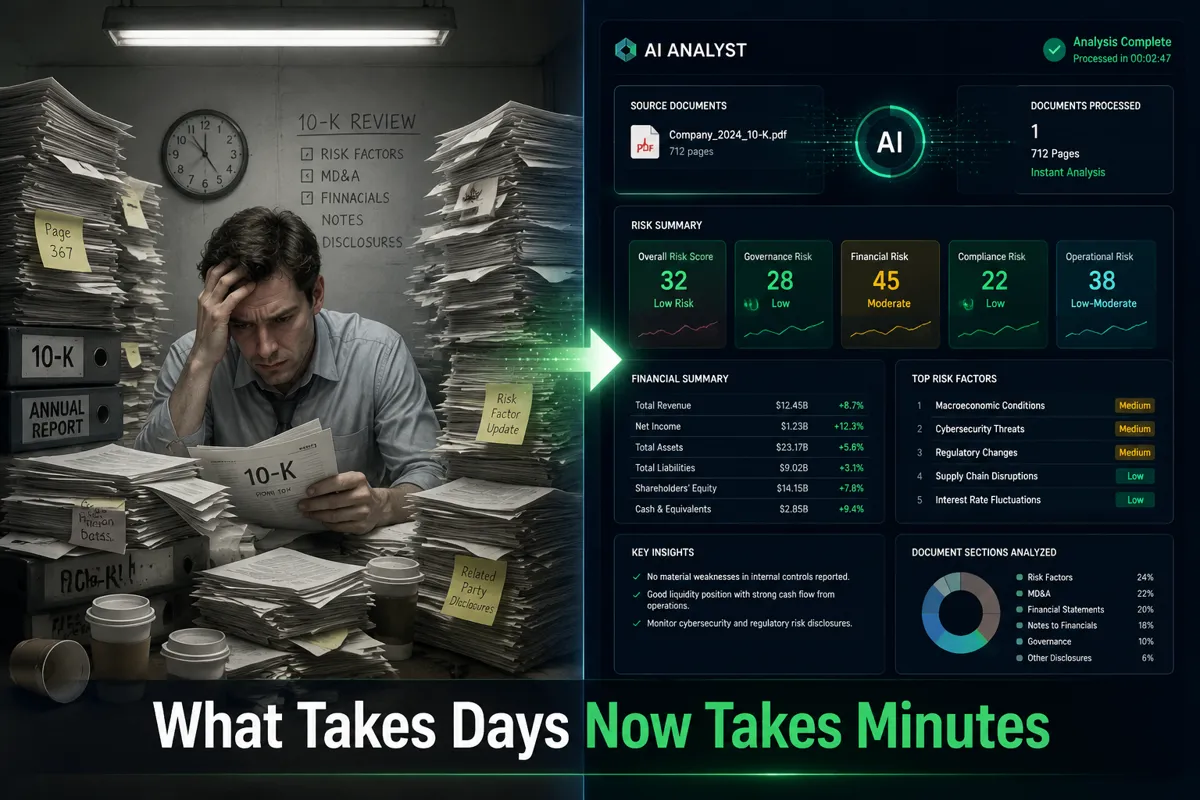
Here's the context. Every public US company files a 10-K with the SEC once a year. It's the most comprehensive financial document a company produces: audited financials, business description, risk factors, management discussion, and legal disclosures. A thorough 10-K can run 150 to 300 pages. Reading one properly takes a trained analyst several hours. Reading fifty of them across a watchlist is a full-time job.
That's the problem these tools solve.
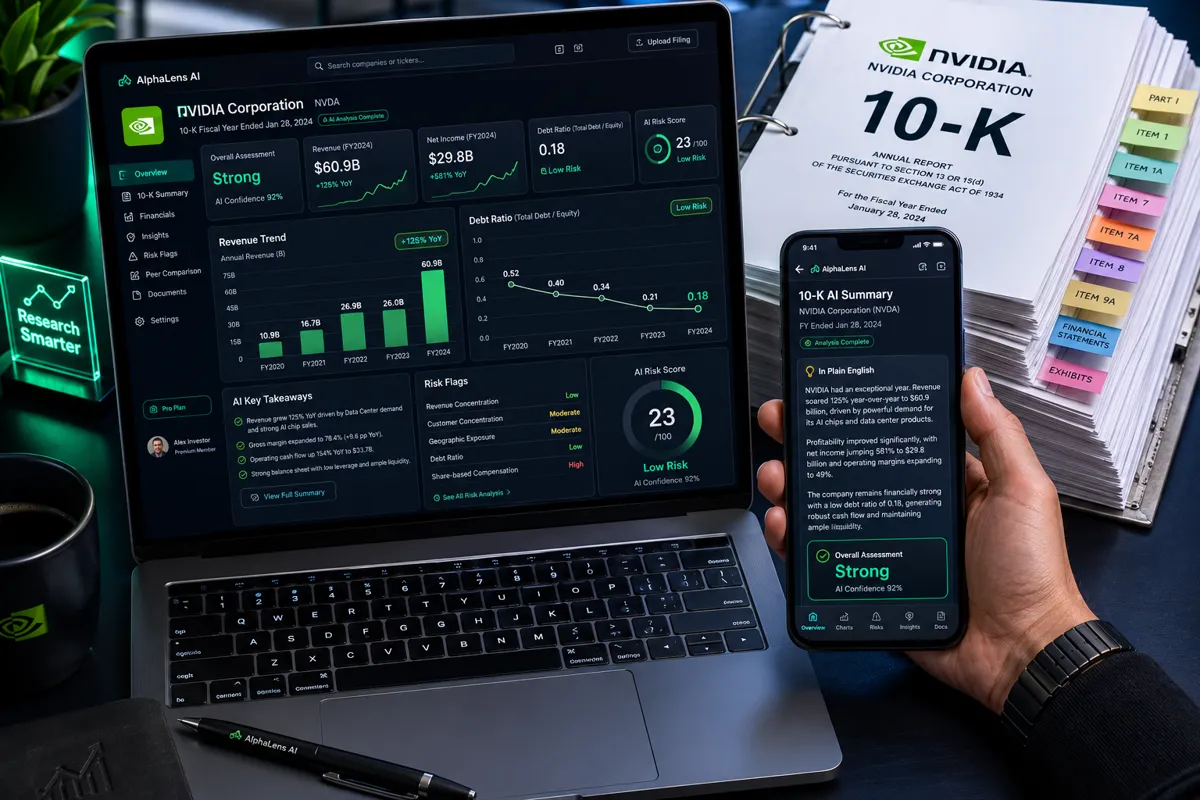
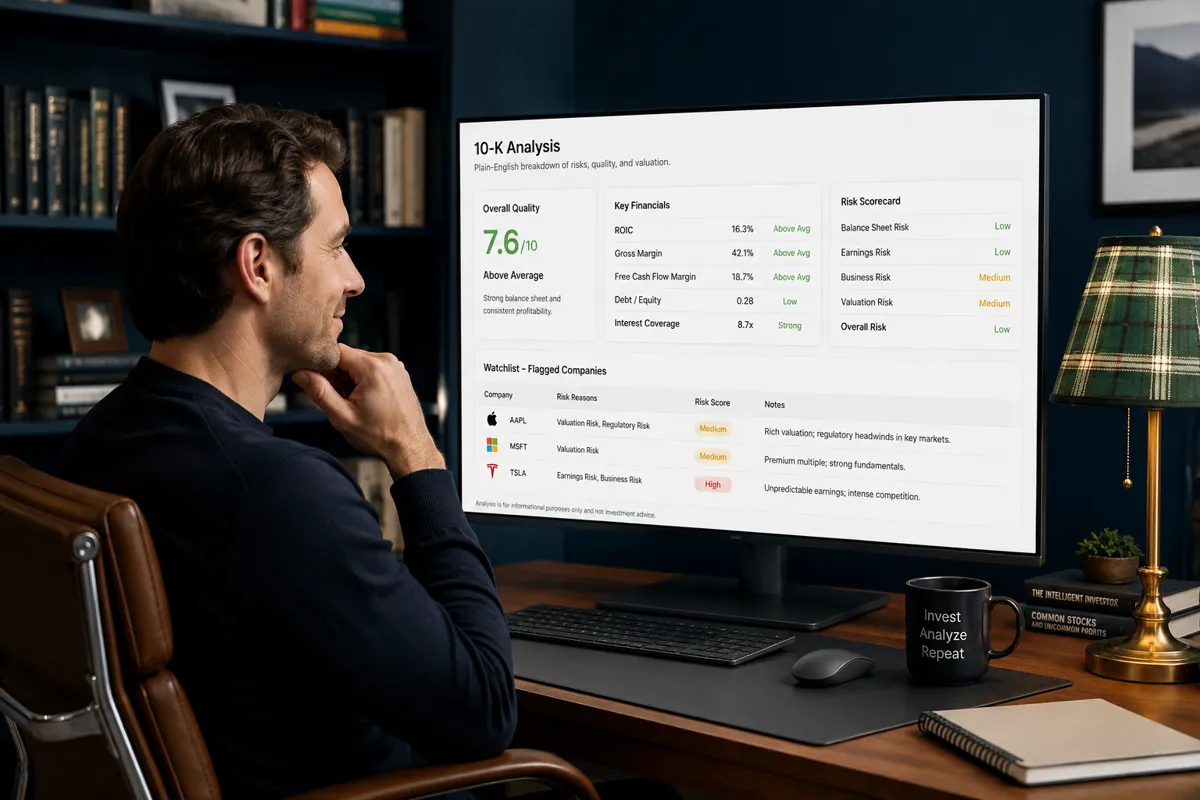
Platforms like Deepfolio generate research briefs structured like a senior analyst's workbook, built from real SEC filings and verifiable line by line. Solon can analyze any 10-K in under five minutes, guiding users with suggested questions and plain-English answers. Veilscope converts dense filings into risk scorecards with direct links back to the original source text.
The underlying technology is large language model (LLM) processing — the same family of AI that powers conversational tools — trained or fine-tuned on financial documents. The AI reads the filing, identifies the relevant sections, extracts structured data, and surfaces what matters.
What you get: the signal. What you skip: 200 pages of legal boilerplate.
The AI Stock Research Tool That Reads Every 10-K So You Don't Have To — How It Actually Works
This is where most explainers get vague. Let's be specific.
The workflow for a modern AI 10-K research tool looks like this:
- Ingestion — The tool pulls the filing directly from SEC EDGAR (the SEC's public database) the moment it's submitted. Some platforms like SignalX index filings upon submission, meaning you get the summary within minutes of the document going live.
- Parsing — The AI segments the document into its standard sections: Item 1 (Business), Item 1A (Risk Factors), Item 7 (MD&A — Management Discussion and Analysis), Item 8 (Financial Statements), and so on.
- Extraction — Key metrics are pulled out: revenue, net income, operating cash flow, debt levels, gross margin trends, capital expenditure. The AI also flags language changes between this year's filing and last year's.
- Summarization — The tool generates a plain-English brief. Some platforms, like Beefi.ai, let you ask questions in natural language: "Did revenue growth slow down?" or "What are the top three risk factors?"
- Scoring — More advanced tools like Veilscope assign risk scores or health grades, so you can screen across hundreds of companies without reading a single page.
The practical takeaway: You're not outsourcing the investment decision. You're outsourcing the document processing. The AI does the reading; you do the thinking.
For a broader look at how these tools stack up across the research landscape, the AI stock research tools directory at AI Stock Picker Apps covers the full field.
How Much Does This Kind of AI Research Tool Cost?
Pricing for AI 10-K analysis tools in 2026 ranges from free (with significant limitations) to $500+/month for enterprise or hedge fund-grade platforms. For retail investors, the practical range is $0 to $200/month.
Here's a rough breakdown by tier:
| Tier | Cost Range | What You Get | Best For |
|---|---|---|---|
| Free | $0 | Basic summaries, limited companies | Beginners testing the concept |
| Starter | $10–$30/month | Full 10-K summaries, screener access | Retail investors, swing traders |
| Pro | $50–$150/month | Multi-filing analysis, alerts, comparisons | Active investors, serious retail |
| Institutional | $200–$500+/month | Real-time indexing, API access, private data | Funds, professional analysts |
Platforms like StoxHub cover over 3,500 companies across US, ASX, and NZX markets with a multi-factor screener built in. Financial Analyst AI positions itself as institutional-grade analysis at a fraction of traditional costs — the key pitch being that you're not paying for a junior analyst's salary, you're paying for a software subscription.
The honest caveat: free tiers are usually fine for exploring a single company. If you're running a watchlist of 20 to 30 names through earnings season, a paid tier pays for itself in time saved.
AI Stock Research Tools vs. Traditional Analyst Reports — Which Actually Wins?
AI tools and traditional analyst reports are solving different problems, and conflating them is a common mistake.
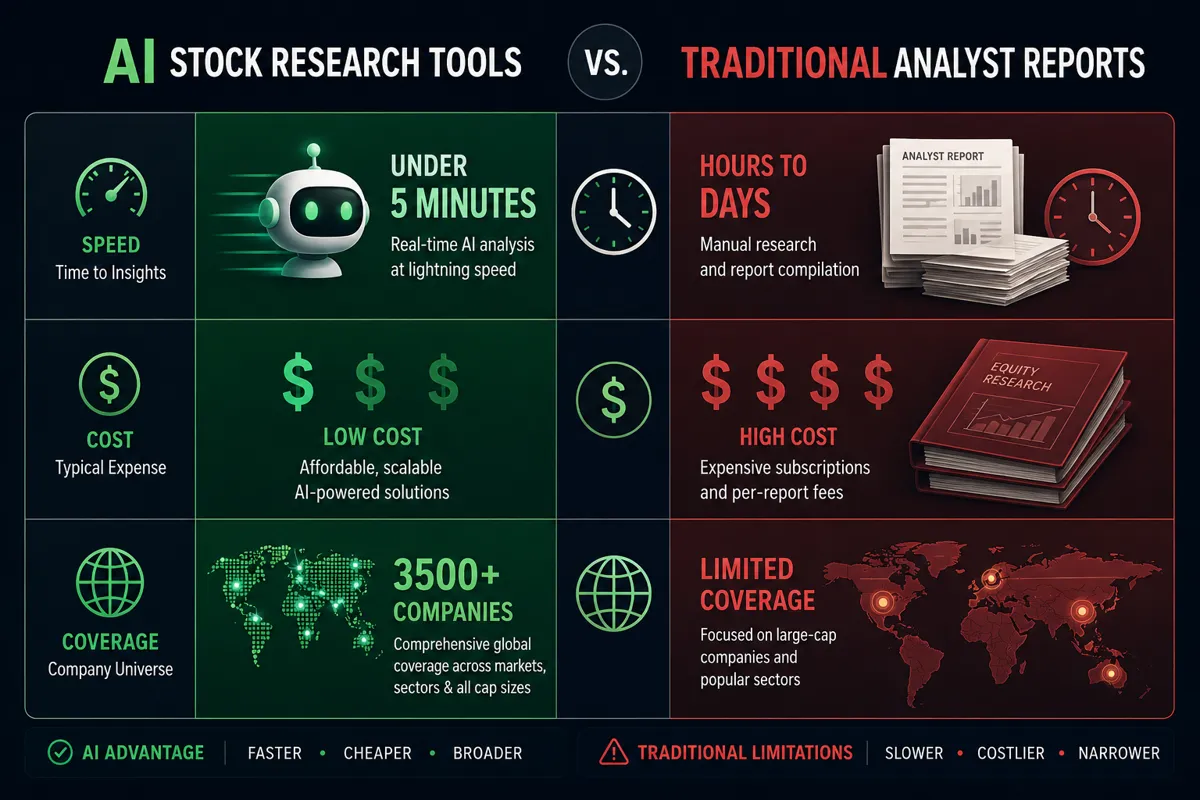
Traditional sell-side analyst reports (the kind that come from Goldman Sachs, Morgan Stanley, or your broker's research desk) include forward-looking price targets, earnings models, and qualitative industry context built from years of relationship access. They're also slow, expensive to produce, and — let's be honest — often influenced by the investment banking relationships of the firm writing them.
AI stock research tools do something different. They're fast, unbiased toward any particular outcome, and they cover far more companies than any analyst team can. What they lack is the forward-looking modeling and the industry-specific context that a seasoned analyst brings.
The practical split:
- Use AI tools for: initial screening, red flag detection, earnings prep, understanding what's in the filing.
- Use analyst reports for: industry context, competitive positioning, and a second opinion on your thesis.
Tools like Koyfin offer institutional-grade data without the Bloomberg price tag — a strong middle ground for investors who want deep fundamentals without the full analyst report overhead. Stock Rover pulls and compares fundamentals across multiple years, which is exactly the kind of longitudinal view that makes 10-K analysis useful.
The real edge isn't choosing one over the other. It's using AI tools to do the screening and data extraction, then applying your own judgment — or a targeted analyst report — for the final call. Systems over hacks.
Can This AI Tool Really Replace a Human Financial Analyst?
No — and any tool that claims otherwise is selling you something. But that's also the wrong question.
A human financial analyst brings three things an AI currently can't replicate well: qualitative judgment about management quality, deep industry-specific pattern recognition built over years, and the ability to read between the lines of what a CFO says on an earnings call versus what the numbers actually show.
What AI does better: speed, consistency, and coverage. A human analyst can cover 20 to 30 companies deeply. An AI tool covers thousands, simultaneously, without fatigue or cognitive bias.
The real answer: AI is a research assistant, not a replacement. It handles the labor-intensive parts of fundamental analysis — reading the filing, extracting the numbers, flagging language changes — so you can focus on the judgment call.
Platforms like Ravana AI position themselves as autonomous research agents, generating investment theses from SEC filings and smart money tracking. That's useful context. But the word "autonomous" should trigger your skepticism reflex. The thesis is a starting point, not a conclusion.
The investors who get the most out of these tools treat them as a first pass, not a final answer. Process over prediction.
What Mistakes Do People Make When Using AI Stock Research Tools?
The biggest mistake is treating the AI summary as the research, not the start of it. That's analysis paralysis in reverse — instead of drowning in data, you're skimming a summary and calling it done.
Common errors to avoid:
- Taking the risk score at face value. A low risk score doesn't mean a good investment. It means the filing language and financials didn't trigger red flags. Those are different things.
- Ignoring the source links. Good platforms like Veilscope and Kerns.ai link every data point back to the original filing. Use those links. Spot-check the AI's reading on anything that affects your thesis.
- Using it as a buy signal. An AI tool tells you what's in the document. It doesn't tell you whether the stock is priced correctly, what the chart looks like, or whether the setup is clean. That's your job.
- Skipping the year-over-year comparison. The most useful thing an AI tool can do is flag what changed between this year's 10-K and last year's. If you're not using that feature, you're leaving the best signal on the table.
- Overtrading on earnings summaries. Knowing what's in a 10-K is not an edge if everyone else has the same AI tool. The edge is in how you interpret it relative to price action and market expectations.
Play stupid games, win stupid prizes. Using an AI summary to justify a trade you already wanted to make is just confirmation bias with extra steps.
Is This Tool Good for Day Traders or More for Long-Term Investors?
AI 10-K reading tools are primarily built for fundamental research, which makes them a better fit for swing traders, position traders, and long-term investors than for pure day traders.
A 10-K is an annual filing. It reflects what happened over the past year. If your holding period is measured in hours or days, the annual report is mostly noise for your trading decisions. What matters to a day trader is real-time price action, level 2 data, volume patterns, and the tape — not what the CFO wrote about risk factors six months ago.
Where the overlap exists:
- Swing traders doing pre-earnings research benefit significantly. Understanding what's in the 10-K before an earnings call means you know the baseline — so you can judge whether the earnings report is actually a surprise or just confirms what the filing already showed.
- Sector rotation traders can use AI filing summaries to quickly screen which companies in a sector have the cleanest balance sheets heading into a macro shift.
- Beginners building a research process should absolutely use these tools. Learning to read a 10-K — even through an AI summary — builds the fundamental literacy that separates disciplined investors from people who are just guessing.
For day trading-specific tools focused on price action and real-time scanning, the day trading tools section covers what actually matters for short timeframes.
What Kind of Investor Should NOT Use an AI 10-K Reading Tool?
Three types of investors will get limited value from these tools and should spend their time elsewhere.
Pure technical traders. If your entire process is price action, support and resistance, and reading the tape, a 10-K summary adds nothing to your entry and exit decisions. Your edge is in the chart, not the filing.
Passive index investors. If you're buying and holding broad index ETFs, you don't need to read individual company filings. The index does the diversification work for you. Spending time on 10-K analysis is a distraction from your actual strategy.
Investors looking for a shortcut to stock picks. This is the FOFO trap — Fear of Figuring Out. Using an AI summary to avoid doing any thinking is not a research process. It's a different flavor of the same mistake people make following a Discord alert. The tool gives you information; the process is still yours to build.
If you fall into any of these categories, the better question is: what does your actual process need? Start there, then find the tool that fits the process.
How Accurate Are AI Insights Compared to Human Research?
For data extraction — pulling revenue figures, debt ratios, cash flow numbers from financial statements — AI tools are highly accurate. They're reading structured data from a standardized document format. The error rate on quantitative extraction is low.
For qualitative interpretation — understanding whether management's tone is overly optimistic, whether a risk factor disclosure is boilerplate or a genuine warning, whether a business model is structurally sound — accuracy drops. This is where human judgment still has a clear edge.
A useful frame: think of AI accuracy like a GPS. It's excellent at telling you where you are and plotting a route. It's less useful when the road conditions have changed and the map hasn't caught up yet.
Kerns.ai addresses this directly by citing every data point back to its source, so users can verify the AI's reading rather than trusting it blindly. That's the right design philosophy. Any tool that doesn't show its work should be treated with more skepticism.
The practical takeaway: trust AI tools for the numbers. Apply your own judgment to the narrative.
What Financial Data Sources Does This AI Tool Actually Pull From?
The best AI stock research tools pull directly from SEC EDGAR — the SEC's public database of all US public company filings. This is the primary source for 10-K (annual), 10-Q (quarterly), and 8-K (material event) filings.
Beyond EDGAR, more advanced platforms layer in additional data:
- Insider trading disclosures (Form 4 filings) — who's buying or selling and at what price
- Institutional holdings (13-F filings) — what major funds own
- Earnings call transcripts — the spoken version of what management is communicating
- Alternative data — web traffic, app downloads, satellite imagery of retail parking lots (yes, that's real)
SignalX indexes SEC EDGAR and DART (Korea's equivalent) filings upon submission and cross-references them with insider trades and fund holdings. That combination — filing data plus smart money activity — is a meaningfully richer signal than any single source alone.
For investors who want to go deeper on alternative data signals layered over fundamentals, AltIndex digests alternative data and filings into actionable signals worth exploring.
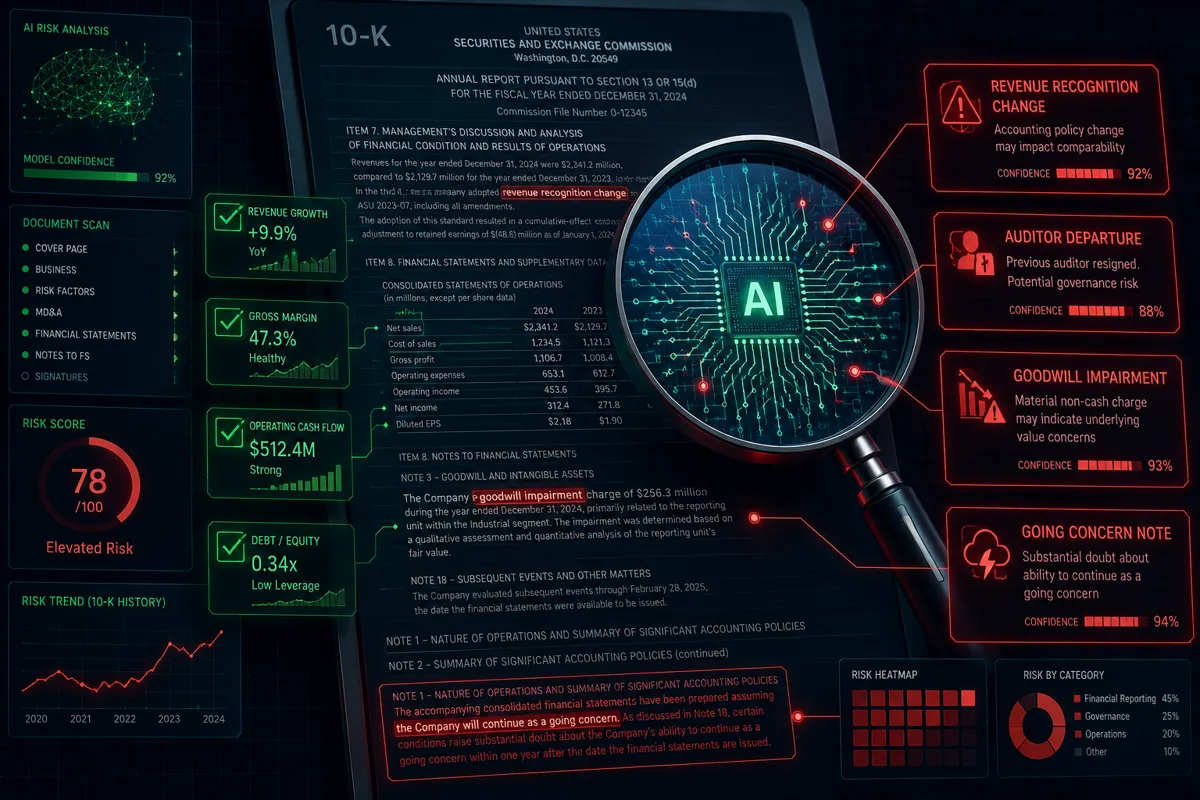
Can the AI Detect Red Flags in Financial Statements That Humans Might Miss?
Yes — and this is arguably the most underrated capability of these tools. AI is particularly good at catching the subtle, easy-to-miss warning signs that get buried in 200 pages of dense text.
Red flags AI tools commonly surface:
- Revenue recognition changes — a company quietly shifting how it books revenue, which can artificially inflate reported numbers
- Auditor switches — a change in the external auditor, especially mid-year, is a significant warning sign
- Going concern language — if the auditor questions the company's ability to continue operating, that phrase appears in a specific section most retail investors never read
- Goodwill impairment — a large write-down of goodwill often signals an acquisition that didn't deliver
- Related-party transactions — deals between the company and executives or board members, buried in the footnotes
- Year-over-year language shifts — the AI can compare this year's risk factor section to last year's and flag new language that wasn't there before
Veilscope specifically highlights key risks and trends in plain English with direct links to the original source text. Deepfolio structures its output like a senior analyst's workbook — verifiable line by line — which makes it easier to trace any flag back to the filing.
The honest caveat: AI flags what's in the document. It can't flag what's been deliberately omitted. That's a limitation worth keeping in mind.
How Quickly Can This AI Tool Process a Full 10-K Report?
Most modern AI 10-K tools generate a summary in under five minutes. Some platforms, like Solon, specifically benchmark their processing time at under five minutes for a complete 10-K analysis.
For context: a trained human analyst doing a thorough first-pass read of a 200-page 10-K takes two to four hours. A deep dive with financial model updates takes a full day or more.
The speed advantage compounds when you're screening multiple companies. Running 20 companies through an AI tool takes roughly the same time as running one. That's not a marginal improvement — it's a structural change in what's possible for a retail investor with a full-time job.
The practical implication: use the speed to do more screening, not less thinking. The goal isn't to read fewer 10-Ks and make faster decisions. The goal is to identify the two or three companies worth your deeper attention out of the twenty you screened.
Cut the noise, keep the alpha.
What Are the Limitations of Using AI for Stock Research?
AI stock research tools are genuinely useful. They also have real limitations that are worth naming clearly, because ignoring them is how investors get into trouble.
Key limitations:
- Recency lag on qualitative context. A 10-K reflects the past year. The business may have changed significantly since filing. AI tools don't know what happened last week.
- No market pricing context. The tool tells you about the business. It doesn't tell you whether the stock is cheap or expensive relative to that business quality. Valuation is a separate step.
- Hallucination risk on qualitative summaries. LLMs can occasionally misread nuanced language or generate plausible-sounding summaries that don't perfectly reflect the source text. This is why source citations matter — always spot-check.
- Limited coverage of small and micro-cap companies. Many AI tools focus on larger, more widely covered companies. Low float, micro-cap names may have incomplete or no AI coverage.
- No replacement for industry expertise. Understanding whether a biotech's pipeline is credible or whether a semiconductor company's competitive moat is real requires domain knowledge that general-purpose AI tools don't have.
The AI stock prediction tools overview covers where AI-generated signals are most and least reliable — worth reading before you build a process around any single tool.
Does This Tool Work for International Stocks or Just US Companies?
Most AI 10-K reading tools are built primarily for US-listed companies, because SEC EDGAR is the most structured, accessible, and standardized filing database in the world. But coverage is expanding.
StoxHub covers over 3,500 companies across US, ASX (Australian Securities Exchange), and NZX (New Zealand Exchange) markets. Beefi.ai supports analysis in 14 languages and provides real-time financial metrics tracking, which suggests broader international applicability. SignalX indexes both SEC EDGAR and DART — South Korea's equivalent filing system.
The honest picture for international stocks:
- US-listed companies: excellent coverage, real-time indexing, deep feature sets
- Australian and New Zealand markets: growing coverage, fewer tools available
- European markets: limited AI tool coverage as of 2026; most platforms don't yet index ESMA filings systematically
- Emerging markets: largely uncovered by retail-focused AI tools
If your watchlist is primarily US equities, you're well-served by the current tool landscape. If you're running an internationally diversified portfolio, verify coverage before subscribing to any platform.
FAQ
What is a 10-K filing?
A 10-K is an annual report that every US public company must file with the SEC. It includes audited financial statements, a description of the business, risk factors, and management's discussion of the company's performance. It's the most comprehensive official financial document a company produces each year.
Do I need to know accounting to use an AI 10-K tool?
No. That's the point. Tools like Solon and Veilscope translate the filing into plain English, so you can understand the key takeaways without knowing how to read a balance sheet from scratch.
Are these tools legal to use for investment decisions?
Yes. They're reading publicly available SEC filings. There's no regulatory issue with using AI to analyze public documents. These tools don't provide insider information — they process the same filings anyone can access on SEC.gov.
How is an AI 10-K tool different from just reading the SEC filing myself?
Speed and pattern recognition. You could read the 10-K yourself — it's public. The AI processes it in minutes, flags changes from prior years, extracts the key metrics, and surfaces risk language you might skim past. It's the difference between reading a book and having a research assistant who's already read it and highlighted what matters.
Can AI tools analyze 10-Q filings too?
Yes. Most platforms that handle 10-K filings also process 10-Q (quarterly) filings and 8-K (material event) filings. Quarterly analysis is particularly useful around earnings season when you want to track how the business is trending between annual reports.
What's the best AI stock research tool for beginners?
Beginners should look for tools with plain-English summaries, source citations, and a screener that doesn't require financial modeling knowledge. Veilscope and Beefi.ai are designed with accessibility in mind. Paper trade it first — test the tool's output against your own reading of a filing before you rely on it for real capital decisions.
Will these tools tell me what to buy?
No — and be skeptical of any tool that claims to. AI stock research tools tell you what's in the filing and flag what's changed. The buy or sell decision requires you to combine that information with price action, valuation, your risk tolerance, and your position sizing rules.
How often are the AI summaries updated?
For platforms that index directly from SEC EDGAR upon submission, updates happen within minutes of a new filing going live. For others, there may be a lag of hours to days. Check the platform's update frequency before relying on it for time-sensitive research.
Conclusion
The AI stock research tool that reads every 10-K so you don't have to is not a magic shortcut. It's a legitimate productivity tool that removes the most time-consuming part of fundamental research — the reading — so you can focus on the part that actually requires judgment.
The investors who use these tools well treat them as a first pass. They run a screener, flag the companies worth deeper attention, spot-check the AI's reading against the source filing, and then apply their own process to the decision. That's discipline beats prediction in practice.
The investors who misuse them are the ones who read the summary, skip the thinking, and wonder why the trade didn't work out. That's not an AI problem. That's a process problem.
Here's what to do next:
- Pick one company on your current watchlist and run it through a free-tier AI 10-K tool. Compare what the AI surfaces to what you already knew about the company.
- Check the year-over-year comparison feature. What changed in the risk factors section from last year to this year?
- If the output matches what you find when you spot-check the source filing, you've found a tool worth paying for.
Build the process first. Then add the tools that serve it.
We test the AI stock tools so you don't waste months on the wrong ones. Browse the full breakdowns at aistockpickerapps.com.
References
StoxHub - https://stoxhub.io/?utm_source=openai
Financial Analyst AI (stockanalyst.io) - https://stockanalyst.io/?utm_source=openai
XStreet.AI - https://www.xstreet.ai/?utm_source=openai
Veilscope - https://www.veilscope.com/?utm_source=openai
Ravana AI - https://ravanaai.com/?utm_source=openai
Kerns.ai - https://www.kerns.ai/?utm_source=openai
Beefi.ai - https://www.beefi.ai/?utm_source=openai
Deepfolio - https://deepfolio.ai/?utm_source=openai
Solon - https://www.solonapp.io/?utm_source=openai
SignalX - https://signal-x.app/?utm_source=openai